

Pee Cee Cosma Sope Q1FY26 net profit up 12.6% to ₹335 lakh


Pee Cee Cosma Sope posted a 12.6% YoY rise in Q1FY26 standalone net profit to ₹335.16 lakh, driven by 19.1% revenue growth. Consolidated profit rose 11.9% to ₹325.27 lakh. The Board approved ₹5 crore infusions into Pee Cee Energy and Abhaya Nourishtech.


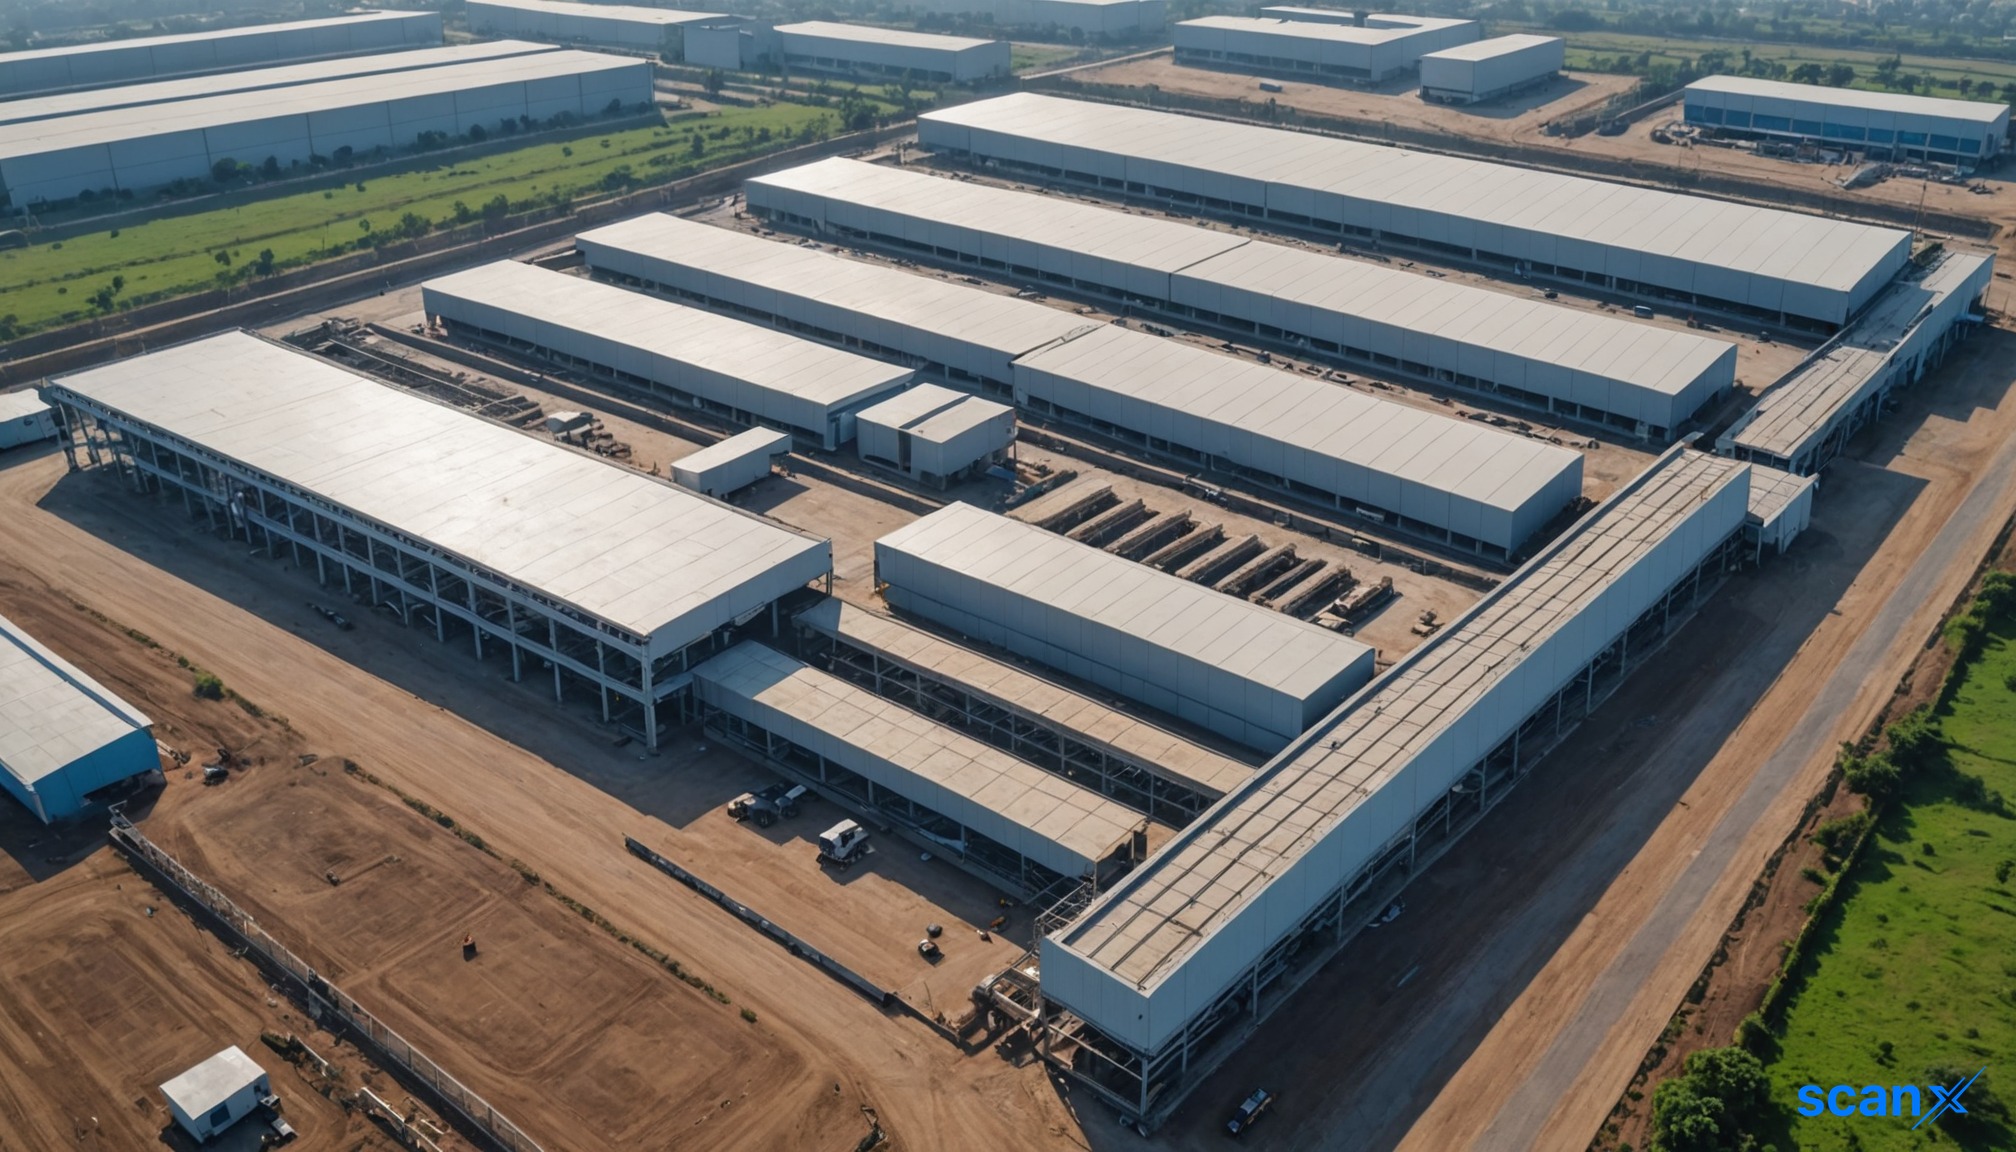
*this image is generated using AI for illustrative purposes only.
Pee Cee Cosma Sope reported a 12.6% year-on-year rise in standalone net profit to ₹335.16 lakh for the quarter ended June 30, 2026 (Q1FY26), driven by a 19.1% increase in revenue from operations to ₹4,742.92 lakh. Consolidated net profit rose 11.9% to ₹325.27 lakh, with consolidated revenue reaching ₹4,928.20 lakh, up 23.4% from the same period last year.
The company’s Board of Directors, in a meeting held on August 12, 2026, approved the unaudited standalone and consolidated financial results for the quarter. The Board also authorized capital infusions of up to ₹5 crore each into two wholly owned subsidiaries: Pee Cee Energy and Reality Ltd and Abhaya Nourishtech Ltd. These investments aim to address working capital needs and support business expansion in the energy, infrastructure, and nutraceutical segments.
Financial Performance
Standalone revenue from operations grew to ₹4,742.92 lakh in Q1FY26, compared to ₹3,980.98 lakh in Q1FY25. Other income stood at ₹123.56 lakh, reversing a loss of ₹146.66 lakh in the preceding quarter. Total expenses rose to ₹4,407.23 lakh from ₹3,664.20 lakh a year ago, primarily due to higher cost of materials consumed at ₹3,786.29 lakh.
| Metric | Q1FY26 | Q1FY25 | Change |
|---|---|---|---|
| Revenue from Operations (Standalone) | ₹4,742.92 lakh | ₹3,980.98 lakh | +19.1% |
| Net Profit (Standalone) | ₹335.16 lakh | ₹298.56 lakh | +12.6% |
| Revenue from Operations (Consolidated) | ₹4,928.20 lakh | ₹3,995.17 lakh | +23.4% |
| Net Profit (Consolidated) | ₹325.27 lakh | ₹290.55 lakh | +11.9% |
Consolidated other income was ₹123.56 lakh. Finance costs remained minimal at ₹5.48 lakh, while depreciation and amortization expenses totaled ₹36.30 lakh. The effective tax rate for the quarter resulted in total tax expenses of ₹125.74 lakh on a consolidated basis.
What the Numbers Show
The divergence between the 19.1% standalone revenue growth and the 12.6% net profit growth indicates margin compression in the core manufacturing segment. While top-line expansion was robust, the cost of materials consumed rose disproportionately, increasing from ₹2,892.81 lakh in Q1FY25 to ₹3,786.29 lakh in Q1FY26. This suggests that input cost inflation or volume mix shifts may be exerting pressure on operating leverage, despite the overall improvement in profitability.
Strategic Investments
The Board approved additional equity share acquisitions in its subsidiaries to strengthen liquidity and operational capacity:
- Pee Cee Energy and Reality Ltd: Investment of up to ₹5 crore for energy and infrastructure-related activities. The subsidiary has nil turnover as it was incorporated recently.
- Abhaya Nourishtech Ltd: Investment of up to ₹5 crore for milk proteins, plant proteins, and nutraceutical ingredients. The subsidiary reported a turnover of ₹1.62 crore.
These moves align with the group’s strategy to diversify beyond its primary laundry soap and detergent manufacturing business into infrastructure, energy, and nutritional ingredients. The 39th Annual General Meeting is scheduled for September 29, 2026.
Historical Stock Returns for Pee Cee Cosma Sope
| 1 Day | 5 Days | 1 Month | 6 Months | 1 Year | 5 Years |
|---|---|---|---|---|---|
| +2.11% | 0.0% | -6.53% | +41.26% | -3.37% | +224.53% |

How does Pee Cee Cosma plan to mitigate the margin compression caused by the disproportionate rise in material costs relative to revenue growth?
What specific milestones or revenue targets are expected from Pee Cee Energy and Reality Ltd following the ₹5 crore capital infusion, given its current nil turnover status?
Will the expansion into nutraceuticals via Abhaya Nourishtech Ltd require significant additional capex beyond the approved ₹5 crore to achieve operational scale?
 18
18






 Access 50+ Readymade Screeners
  Use 200+ Custom Filters
  Get Full Market Insights





