

Page Industries Q4FY26 revenue rises 14.1% to ₹12,526 million


Page Industries reported a 14.1% YoY revenue increase to ₹12,526 million for Q4FY26, driven by volume-led growth and premiumization. PAT rose 9% to ₹1,787 million with an EBITDA margin of 20.8%. For FY26, revenue grew 6.3% to ₹52,468 million. The company maintained an EBITDA margin guidance of 19%-21% for the coming year and expects subsidies of ₹40-50 crores from its Odisha facility in FY27.


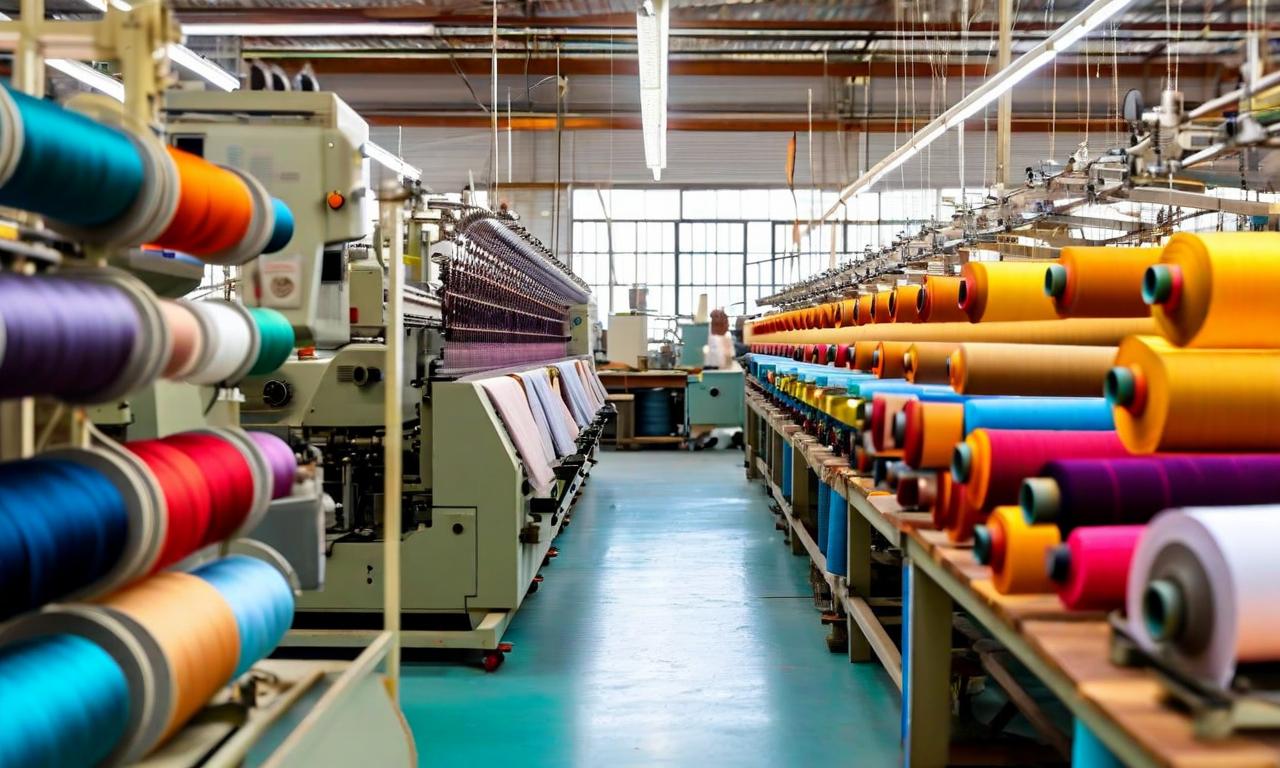
*this image is generated using AI for illustrative purposes only.
Page Industries reported a 14.1% year-on-year increase in revenue to ₹12,526 million for the quarter ended March 31, 2026, driven by volume-led growth and premiumization. Profit after tax for Q4FY26 rose by 9% to ₹1,787 million, while EBITDA grew by 10.7% to ₹2,605 million, maintaining a margin of 20.8%. The company attributed the performance to improved consumer sentiment, strategic initiatives, and a calibrated price increase of 2% in select styles effective from mid-January.
Financial Performance
The company witnessed strong sales volume growth, with pieces sold increasing by 10.8% year-on-year to 54.5 million in Q4FY26. Management noted that the delta between volume and value performance was largely a reflection of product mix and premiumization rather than price hikes. For the full fiscal year FY26, revenue grew by 6.3% to ₹52,468 million, and PAT increased by 4.8% to ₹7,638 million. Annual sales volume reached 228.4 million pieces, a 3.9% increase over the previous year.
| Metric | Q4FY26 Value | Q4FY26 Growth | FY26 Value | FY26 Growth |
|---|---|---|---|---|
| Revenue (₹ million) | 12,526 | 14.1% | 52,468 | 6.3% |
| PAT (₹ million) | 1,787 | 9% | 7,638 | 4.8% |
| EBITDA (₹ million) | 2,605 | 10.7% | 11,529 | 8.5% |
| EBITDA Margin | 20.8% | - | 22% | - |
| Sales Volume (million pieces) | 54.5 | 10.8% | 228.4 | 3.9% |
Operational Highlights
Page Industries expanded its distribution network, which stood at approximately 116,600 multi-brand outlets, 1,615 exclusive brand stores, and 893 large-format stores. The company continues to lead across e-commerce platforms, with the channel contributing 15% to the total top line. Management highlighted a reduction in competitive intensity, particularly in the offline space, which has supported market share gains. The company also noted that inventory days increased to 73 by the end of Q4FY26 from 64 at the beginning of the year, a conscious decision to hedge against anticipated raw material price increases.
Outlook and Guidance
Looking ahead, the company maintained its EBITDA margin guidance range of 19% to 21% for the coming year, citing potential inflationary pressures on input costs and a planned increase in marketing expenditure to approximately 5% of sales. Management expressed confidence in sustaining double-digit volume growth momentum. Additionally, the company expects to realize subsidies ranging from ₹40 crores to ₹50 crores in FY27 from its Odisha facility, covering wage, power, and capital investment-related incentives.
Source: https://lodr-files.dhan.co/lodr-inputs/Company/INE761H01022/e3b1b88753bf467d.pdf
Historical Stock Returns for Page Industries
| 1 Day | 5 Days | 1 Month | 6 Months | 1 Year | 5 Years |
|---|---|---|---|---|---|
| +0.76% | -1.82% | +1.88% | +15.37% | -9.89% | +15.63% |

How will the planned increase in marketing expenditure to 5% of sales impact the company's operating leverage in FY27?
What specific raw material commodities are driving the inventory buildup, and how effectively will this hedge mitigate margin compression?
Can the double-digit volume growth momentum be sustained if competitive intensity in the offline sector returns to previous levels?
 16
16










 Create Custom Screeners
  Access 200+ Pre-built Filters
  Use 50+ Readymade Screener





