

Nureca Q2FY27 Results: Revenue up 55% YoY to ₹58.53 crore, 20-quarter high


- Revenue from operations rose 55% YoY to ₹58.53 crore, the highest quarterly figure in 20 quarters
- Operating profit grew 60% YoY to ₹5.23 crore, driven by fixed cost leverage
- Net profit increased 12% YoY to ₹4.05 crore, with EPS rising to ₹4.25
- Working capital pressures led to negative operating cash flow of ₹12.54 crore for H1FY27
- E-commerce channels contributed 88% of total revenue, with offline sales growing 90% YoY

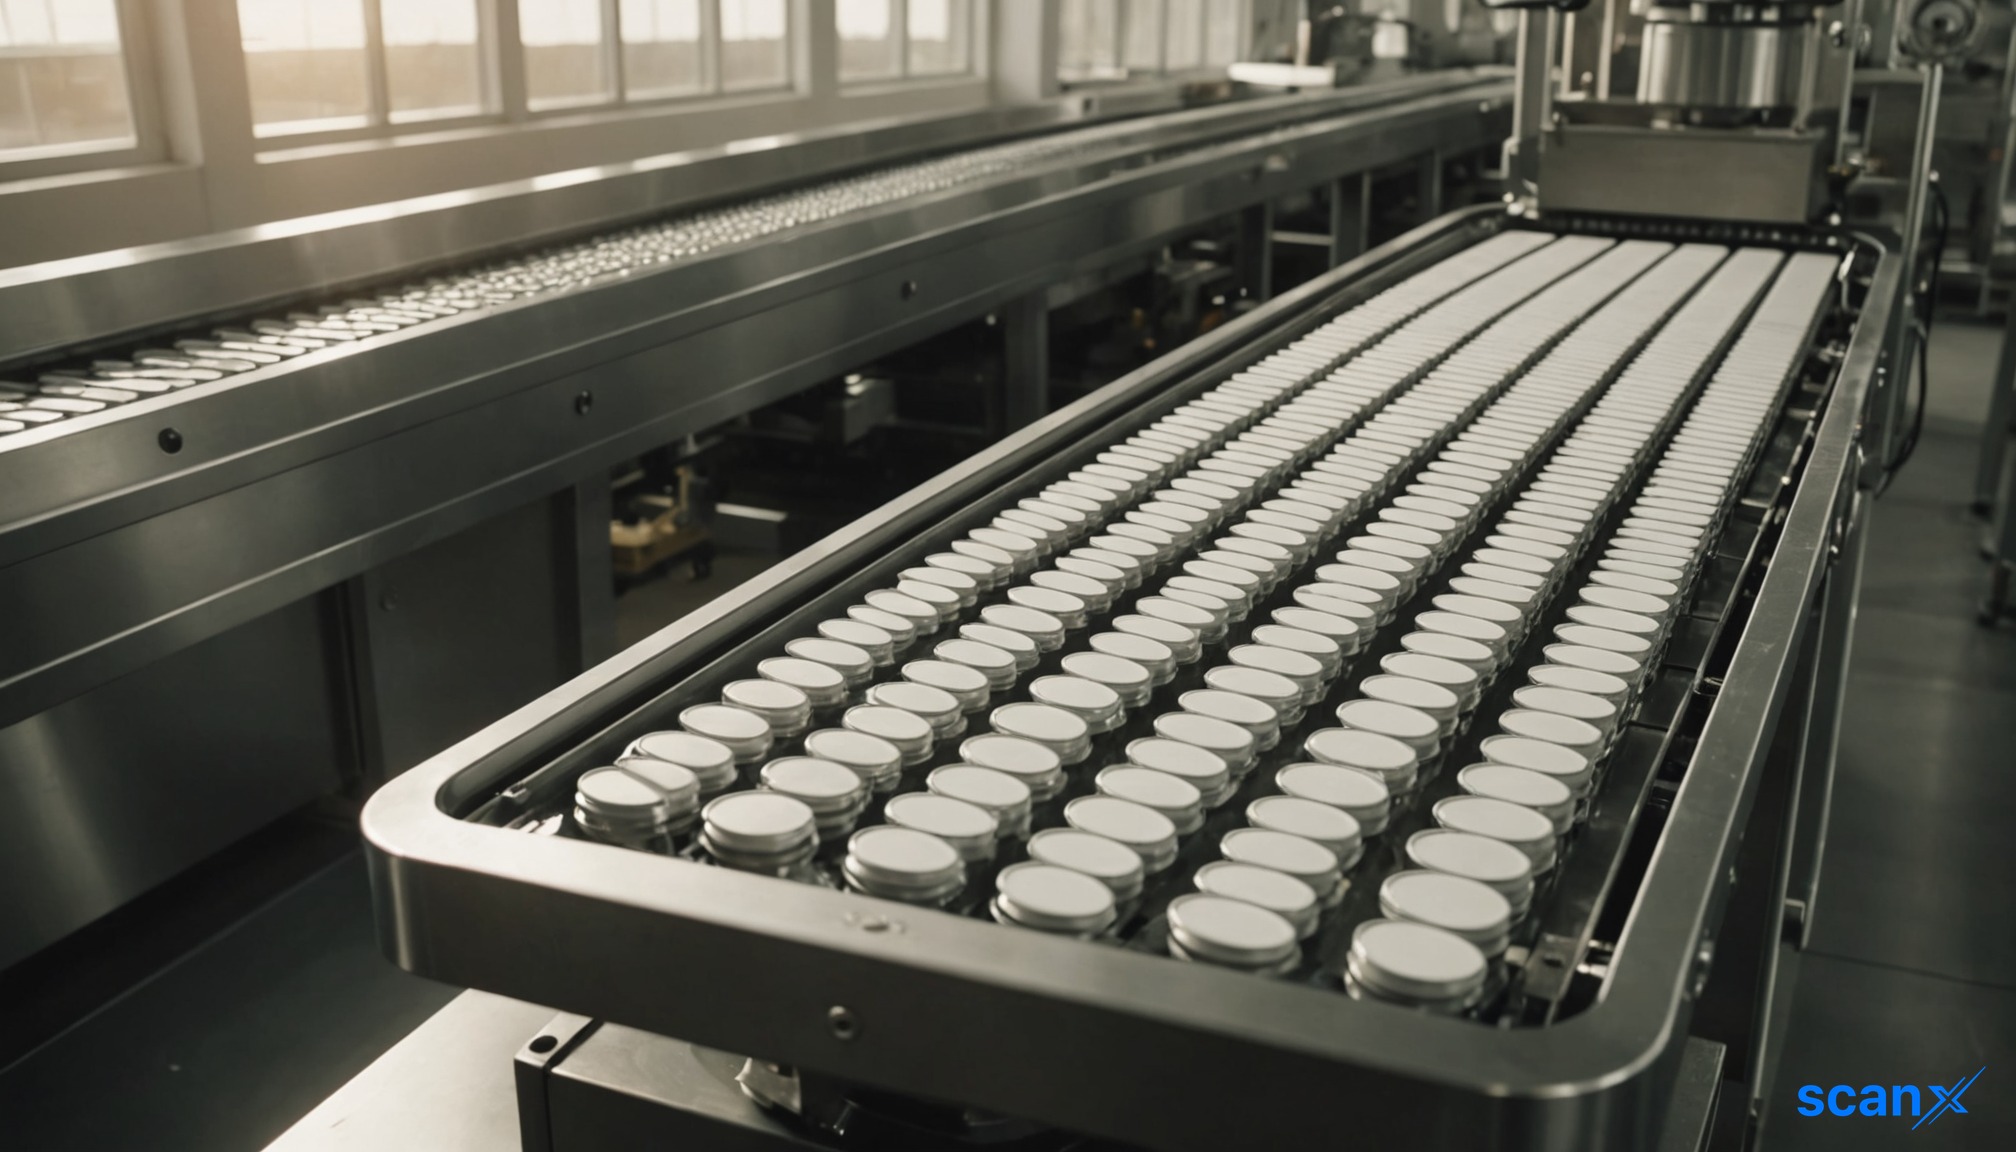

*this image is generated using AI for illustrative purposes only.
Nureca Ltd recorded its highest quarterly revenue in the last 20 quarters, with consolidated revenue from operations rising 55.1% year-on-year to ₹58.53 crore (₹585.26 million) for Q2FY27. The home healthcare and wellness products company also saw operating profit grow 60% to ₹5.23 crore, reflecting improved operational leverage.
The board approved the unaudited standalone and consolidated financial results on October 21, 2026. While profitability and top-line growth were robust, the company faced working capital pressures, resulting in negative operating cash flows during the half-year period as it built inventory ahead of the festive season.
Financial Performance Overview
The consolidated results highlight strong demand recovery compared to the corresponding quarter last year. Revenue growth outpaced the increase in expenses, leading to margin expansion. The table below summarizes key consolidated metrics for Q2FY27 against prior periods.
| Metric | Q2FY27 | Q2FY26 | YoY Change |
|---|---|---|---|
| Revenue from operations | ₹58.53 crore | ₹37.74 crore | +55.1% |
| Operating profit | ₹5.23 crore | ₹3.27 crore | +60.0% |
| Other income | ₹1.35 crore | ₹2.32 crore | -41.6% |
| Profit before tax | ₹5.52 crore | ₹4.60 crore | +20.0% |
| Net profit (PAT) | ₹4.05 crore | ₹3.63 crore | +11.7% |
| EPS (Basic & Diluted) | ₹4.25 | ₹3.63 | +17.1% |
Note: Figures converted to INR crores for consistency with press release highlights.
Segment and Channel Dynamics
Nureca operates in a single business segment: "Home healthcare and wellness products." Consequently, no reportable segments are disclosed under Ind AS 108. The company noted that revenue growth was broad-based across e-commerce, quick-commerce, and offline distribution channels. E-commerce sales contributed to 88% of total revenue, with online sales increasing by 55% both year-on-year and quarter-on-quarter. Offline revenue grew significantly, rising 90% YoY and 49% QoQ.
The company remains debt-free. Operating profit growth ahead of revenue reflects a largely fixed cost base, with employee costs declining as a proportion of revenue.
Balance Sheet and Cash Flow Dynamics
The company's balance sheet reflects a strategic shift in asset allocation and working capital management. Total assets grew to ₹2,312.75 million as of September 30, 2026, up from ₹1,961.57 million at the end of the previous fiscal year.
A notable change occurred in the current assets composition. Inventories increased significantly to ₹629.87 million, while trade receivables surged to ₹271.06 million from ₹77.49 million in March 2026. This accumulation contributed to a negative operating cash flow of ₹125.38 million for the half-year ended September 30, 2026, compared to a positive inflow of ₹44.46 million in the previous year. The company stated that working capital increased reflecting inventory and channel positioning ahead of the festive and winter season.
Conversely, the company utilized funds from investing activities, generating a net inflow of ₹124.52 million in the first half of FY27, primarily through the redemption of fixed deposits (₹331.51 million), which offset the operational cash burn.
What the Numbers Show
A divergence between profit growth and cash generation is evident in the H1FY27 results. While net profit rose 60.4% YoY to ₹7.12 crore for the half-year, operating cash flows swung from positive to negative. This indicates that earnings quality was impacted by substantial investments in working capital, specifically inventory buildup and higher receivables. The rise in trade payables to ₹295.98 million partially mitigated this cash outflow, suggesting the company is leveraging supplier credit to fund its operational expansion.
Corporate Actions and Segment Details
The results were reviewed by the Audit Committee and approved by the Board of Directors. Singhi & Co., Chartered Accountants, served as the statutory auditor and conducted a limited review of the standalone and consolidated statements.
Additionally, the company noted that the Scheme of Merger involving its wholly owned subsidiary, Nureca Technologies Private Limited, remains pending sanction from the National Company Law Tribunal. No accounting impact has been recognized in these results pending final approval.
Historical Stock Returns for Nureca
| 1 Day | 5 Days | 1 Month | 6 Months | 1 Year | 5 Years |
|---|---|---|---|---|---|
| +5.00% | -0.75% | -4.93% | +24.66% | +13.72% | -81.91% |

How quickly does Nureca expect to convert the elevated inventory and trade receivables into cash flow during the upcoming festive season?
What is the projected timeline for the National Company Law Tribunal to sanction the merger with Nureca Technologies, and how might it impact future consolidated reporting?
Can Nureca sustain its 55% revenue growth trajectory in Q3FY27, or does the current surge reflect a temporary post-pandemic demand normalization?
















 Access 50+ Readymade Screeners
 Use 200+ Custom Filters
 Get Full Market Insights





