

Nilkamal Q1 Results: EBITDA Jumps to ₹746 Million, Margin Expands to 9.10%


Nilkamal reported Q1 FY27 EBITDA of ₹746 million vs ₹580 million last year, with EBITDA margin expanding to 9.10% from 6.57% YoY. Consolidated revenue stood at ₹8.2 billion, down from ₹8.8 billion, while consolidated PAT rose to ₹243 million from ₹152 million. Standalone PAT surged 145% to ₹23 crore, supported by retail segment turnaround and significant reduction in net borrowings to ₹116 crore from ₹331 crore.


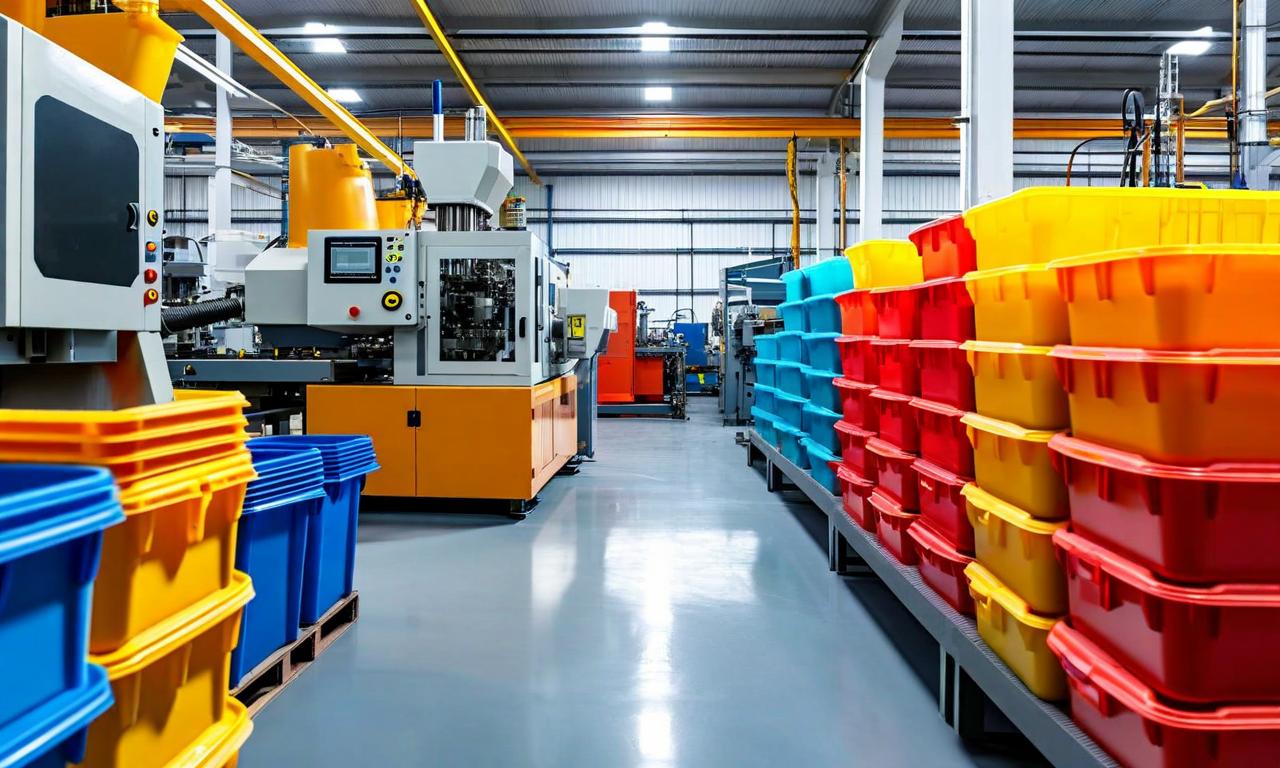
*this image is generated using AI for illustrative purposes only.
Nilkamal Limited reported a significant improvement in profitability for the first quarter of FY27, with consolidated net profit rising to ₹243 million from ₹152 million in the year-ago period. EBITDA grew to ₹746 million from ₹580 million in the corresponding period last year, with the EBITDA margin expanding to 9.10% from 6.57% year-on-year. Consolidated revenue stood at ₹8.2 billion, down from ₹8.8 billion in the year-ago period. On a standalone basis, net profit after tax (PAT) surged 145% year-on-year to ₹23 crore, even as standalone revenue from operations declined 8% to ₹799 crore. The Board of Directors, meeting on August 1, 2026, approved the unaudited financial results, which were reviewed by statutory auditors S R B C & Co LLP with an unmodified opinion.
The divergence between revenue contraction and profit expansion stems from strategic pricing actions and segment-specific performance. While the Business-to-Business (B2B) segment faced a severe 37% volume degrowth due to raw material costs rising approximately 50% since March 2026, management mitigated the impact through proactive price increases and product mix optimization. Consequently, B2B value degrowth was contained to 10%, and profitability in this segment remained stable. In contrast, the Retail and E-commerce segment emerged as a key growth driver, expanding 13% year-on-year to ₹104 crore and turning profitable with an EBIT of ₹1.68 crore, compared to a loss of ₹9.5 crore in the corresponding quarter of the previous year.
Consolidated figures reflect similar trends, with net sales standing at ₹820 crore against ₹883 crore in Q1FY26. The company's balance sheet also showed improvement, with net borrowings declining to ₹116 crore as of June 30, 2026, down from ₹331 crore a year earlier. Capital expenditure during the quarter stood at ₹41 crore, up from ₹36 crore in Q1FY26, indicating continued investment in capacity and efficiency.
Key Financial Highlights
The following table summarises the key financial metrics for the latest quarter:
| Metric: | Q1FY27 | Q1FY26 |
|---|---|---|
| Consolidated Revenue | ₹8.2 billion | ₹8.8 billion |
| EBITDA | ₹746 million | ₹580 million |
| EBITDA Margin | 9.10% | 6.57% |
| Standalone Revenue | ₹799 crore | ₹868 crore |
| Standalone PAT | ₹23 crore | ₹9 crore (approx.) |
| Consolidated Net Sales | ₹820 crore | ₹883 crore |
| Consolidated PAT | ₹243 million | ₹152 million |
| Net Borrowings | ₹116 crore | ₹331 crore |
| Capital Expenditure | ₹41 crore | ₹36 crore |
| Operating Margin | 8.75% | 6.27% |
| Debt Service Coverage | 4.03x | — |
Segment Performance Breakdown
The performance variance across business units underscores the shifting demand dynamics within Nilkamal's portfolio. The following table details the standalone segment-wise results:
| Segment: | Revenue (₹ Crore) | YoY Change | EBIT (₹ Crore) | YoY Change |
|---|---|---|---|---|
| Business to Business | 716 | -10% | Stable | Stable |
| Retail and E-commerce | 104 | +13% | 1.68 | Turnaround |
| Total | 799 | -8% | — | — |
Within the B2B segment, performance was mixed. The Mattress and Foam Business grew by 49%, and Ready Furniture expanded by 20%. However, these gains were offset by declines in Plastic Furniture (-13%), Material Handling (-16%), and Bubbleguard (-36%). The Retail network, comprising 100 stores under the COCO and FOFO formats, saw store-based growth of 6%, while e-commerce channels grew faster at 22%.
What the Numbers Show
A critical observation from the filing is the decoupling of volume growth from profitability. Nilkamal demonstrated pricing power by absorbing a ~50% surge in raw material costs without passing on the full impact to customers, thereby preserving margins. The operating margin improved to 8.75% from 6.27% in Q1FY26, and the EBITDA margin expanded to 9.10% from 6.57%, suggesting that the current strategy of mix optimisation and selective price hikes is effective in shielding bottom-line results even when top-line volumes contract. This resilience is further supported by a strong debt service coverage ratio of 4.03 times, indicating robust cash flow generation relative to debt obligations.
CARE Ratings Ltd reaffirmed Nilkamal's long-term credit rating as CARE AA Stable and short-term rating as CARE A1+, citing the company's strong market position and consistent cash flows. The company disclosed an exceptional item provision of ₹1,541 lakhs towards gratuity and leave liability due to new Labour Codes effective November 21, 2025, which impacted prior year comparables but did not affect the current quarter's operational metrics.
Historical Stock Returns for Nilkamal
| 1 Day | 5 Days | 1 Month | 6 Months | 1 Year | 5 Years |
|---|---|---|---|---|---|
| -1.28% | -1.91% | -9.15% | +59.33% | +18.48% | -32.89% |

How sustainable is Nilkamal's pricing power in the B2B segment if raw material costs continue to rise beyond the 50% surge seen since March 2026?
What specific strategies is management deploying to reverse the volume degrowth in underperforming B2B sub-segments like Plastic Furniture and Material Handling?
Will the continued capital expenditure of ₹41 crore per quarter be sufficient to drive top-line growth in the Retail and E-commerce segment, or are further investments needed to sustain its 13% YoY expansion?
 19
19







 Access 50+ Readymade Screeners
  Use 200+ Custom Filters
  Get Full Market Insights





