

Nebius Latest Results: Shares surge 12.90% on Big Tech AI demand


Nebius Group shares jumped 12.90% to $214.97 following strong earnings from Microsoft, Amazon, Apple, and Meta, which validated AI infrastructure demand. Analysts forecast Nebius revenue to rise to $576.67 million, though losses are expected to widen to 73 cents per share. The stock carries a Buy consensus with an average price target of $232.08.



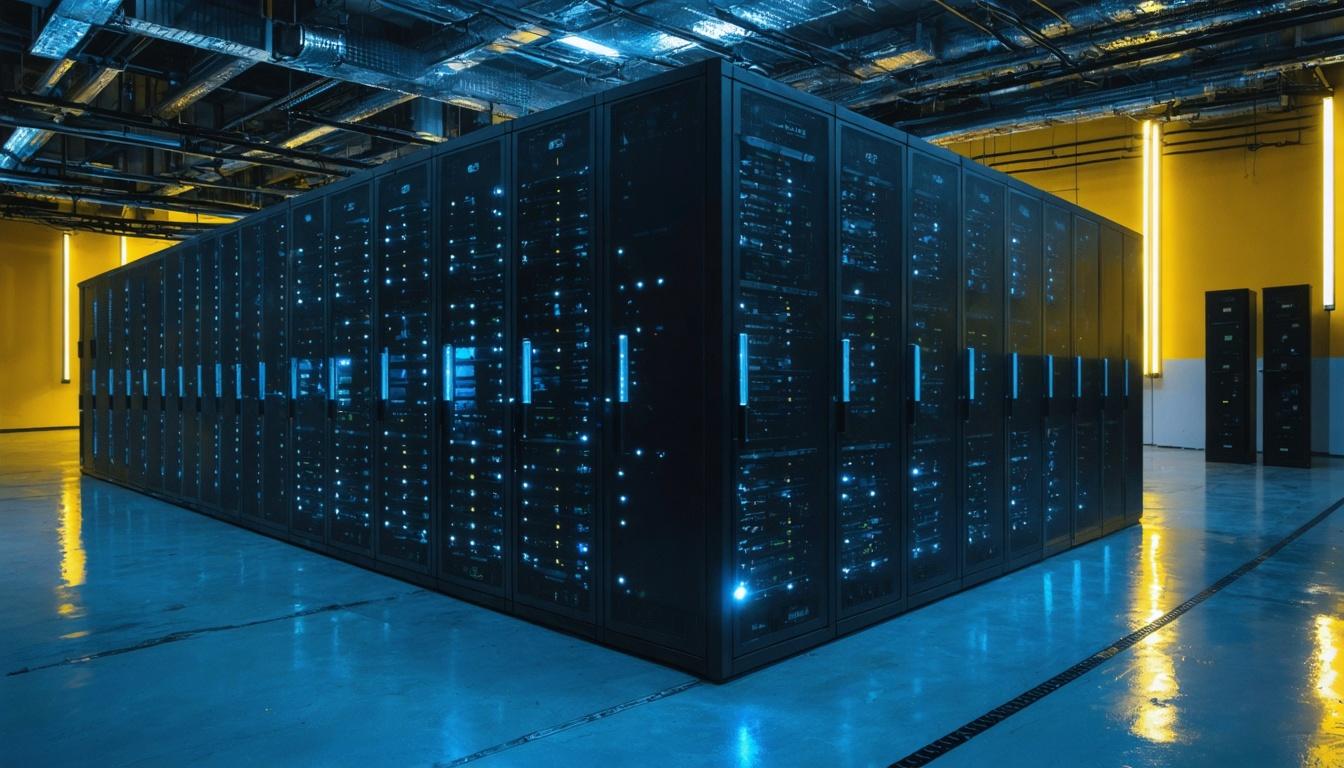
*this image is generated using AI for illustrative purposes only.
Nebius Group N.V. (NASDAQ: NBIS) shares surged 12.90% to close at $214.97 on Monday, outperforming broader market indices as robust quarterly results from major technology companies reinforced investor confidence in artificial intelligence infrastructure. The rally occurred alongside a 1.35% gain in the Nasdaq Composite and a 1.10% rise in the S&P 500, reflecting broad-based optimism regarding long-term GPU computing contracts and AI data-center demand.
The stock’s movement was catalyzed by strong earnings reports from Microsoft Corp, Amazon.com Inc, Apple Inc, and Meta Platforms Inc, all of which cited cloud, AI, and services demand as primary growth drivers. These results provided tangible evidence of sustained enterprise adoption of AI technologies, directly benefiting vertically integrated cloud providers like Nebius that focus on high-performance computing.
Big Tech Earnings Drive Sector Optimism
Microsoft Corp reported fourth-quarter revenue of $90.01 billion, an 18% increase year-over-year. Azure and other cloud services revenue jumped 43%, with CEO Satya Nadella noting that Azure revenue surpassed $100 billion for the year. Additionally, Microsoft 365 Copilot reached 30 million paid seats, signaling deepening integration of AI tools within enterprise workflows.
Amazon.com Inc posted second-quarter revenue of $200.61 billion, up 20% year-over-year. Growth was led by Amazon Web Services (AWS), which delivered its fastest growth in 18 quarters with a 37% increase. CEO Andy Jassy highlighted that both Amazon’s AI and chips businesses exceeded $25 billion in annual run rates, underscoring the scale of infrastructure investment required to support generative AI workloads.
Apple Inc reported its strongest June quarter ever, with revenue rising 16% to $109.42 billion. Meta Platforms Inc saw revenue climb 28% to $60.8 billion, with CEO Mark Zuckerberg stating that AI is accelerating Meta’s core business while opening new enterprise opportunities. These collective results suggest that large-cap technology firms are continuing to prioritize capital expenditure on AI infrastructure, creating a favorable backdrop for specialized cloud providers.
Analyst Outlook and Valuation Metrics
Nebius Group is scheduled to report its own earnings on August 12, 2026. Analysts currently project a loss per share of 73 cents, widening from a loss of 38 cents in the prior year period. However, revenue estimates stand at $576.67 million, a significant increase from $105.10 million year-over-year, indicating rapid top-line expansion despite ongoing profitability challenges.
The stock trades at a price-to-earnings ratio of 73.5x, reflecting a premium valuation relative to peers. This high multiple suggests investors are pricing in substantial future growth driven by AI infrastructure demand. The consensus rating among 20 analysts is Buy, with an average price forecast of $232.08.
Recent Analyst Actions
| Firm | Action | Forecast | Date |
|---|---|---|---|
| Baird | Initiated Outperform | $250.00 | July 22 |
| Northland Capital Markets | Raised Forecast | $410.00 | July 20 |
| Freedom Capital Markets | Upgraded to Buy | $200.00 | July 20 |
What the Numbers Show
The divergence between Nebius’s projected revenue growth and its expanding loss per share highlights the capital-intensive nature of AI infrastructure development. While revenue is expected to grow nearly fivefold year-over-year, the widening loss indicates that significant investment in data centers and GPU capacity is currently outweighing operational cash generation. This pattern is consistent with early-stage hyper-growth tech companies where market share acquisition and capacity building take precedence over immediate profitability. The premium valuation reflects investor belief that these upfront costs will translate into durable competitive advantages and higher margins once scale is achieved.

How might Nebius's widening loss per share impact investor sentiment leading up to its August 12 earnings report, given the high premium valuation?
Will the sustained capital expenditure from Big Tech firms continue to drive demand for specialized cloud providers like Nebius, or could vertical integration by hyperscalers pose a competitive threat?
What specific operational milestones must Nebius achieve to justify its 73.5x P/E ratio and transition from rapid top-line growth to sustainable profitability?
 15
15














 Access Market Heat-map & Insights
  Create, Save & Share your Screener
  Use 200+ Screening Filters





