

Miven Machine Tools Q1 Results: Net loss widens 6% YoY to ₹15.61 lakh


Miven Machine Tools Ltd posted a net loss of ₹15.61 lakh in Q1FY27, slightly wider than the ₹16.64 lakh loss in Q1FY26. Operating income rose to ₹3.00 lakh from nil in the prior year but fell sharply from ₹17.10 lakh in Q4FY26. The board approved the results on August 14, 2026.


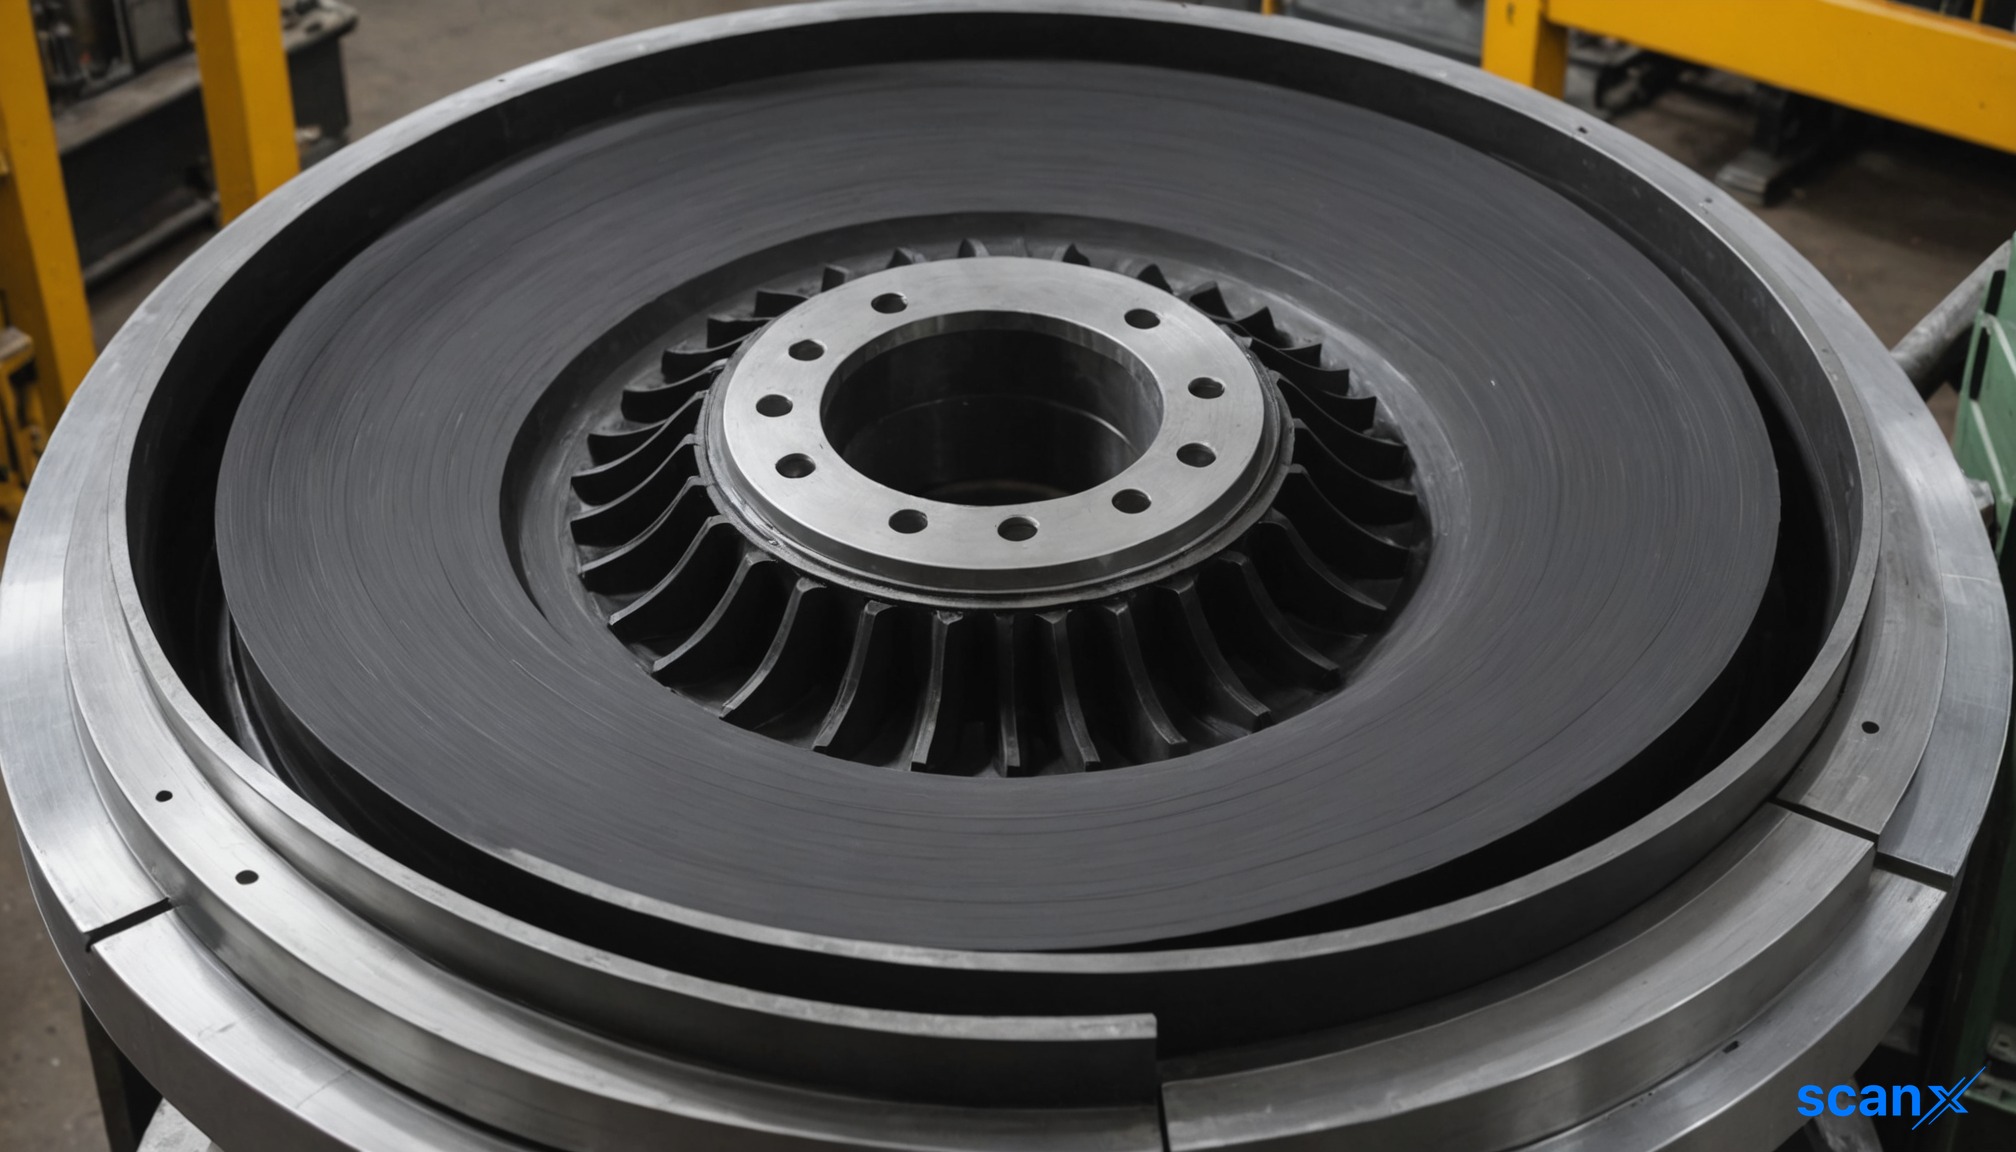
*this image is generated using AI for illustrative purposes only.
Miven Machine Tools Limited reported a net loss of ₹15.61 lakh for the quarter ended June 30, 2026, marking a slight widening of losses compared to the ₹16.64 lakh loss recorded in the corresponding quarter of FY26. The Hyderabad-based manufacturer generated total income from operations of ₹3.00 lakh, a notable shift from nil revenue in Q1FY26, though significantly lower than the ₹17.10 lakh logged in the preceding quarter.
The Board of Directors approved the unaudited standalone financial results in a meeting held on August 14, 2026. The results were reviewed by the Audit Committee and statutory auditors as per SEBI (Listing Obligations and Disclosure Requirements) Regulations, 2015.
Financial Performance
The company’s earnings per share (EPS) came in at negative ₹0.52 for both basic and diluted calculations, down from negative ₹0.55 in Q1FY25. In contrast, the company posted a profit of ₹2.86 lakh and an EPS of ₹0.10 in Q4FY26.
| Metric: | Q1FY27 | Q4FY26 | Q1FY26 | Change (YoY) |
|---|---|---|---|---|
| Total Income: | ₹3.00 lakh | ₹17.10 lakh | Nil | N/A |
| Net Profit/(Loss): | (₹15.61 lakh) | ₹2.86 lakh | (₹16.64 lakh) | Widened 6% |
| EPS (Basic): | (₹0.52) | ₹0.10 | (₹0.55) | Improved 5% |
For the full fiscal year FY26, Miven Machine Tools reported a net loss of ₹43.93 lakh on total income of ₹17.10 lakh. The equity share capital remained unchanged at ₹300.35 lakh.
What the Numbers Show
The divergence between Q4FY26 and Q1FY27 highlights significant volatility in the company's operational scale. While revenue dropped sharply from ₹17.10 lakh in the final quarter of FY26 to just ₹3.00 lakh in the opening quarter of FY27, the net loss narrowed marginally year-on-year. This suggests that fixed costs or overheads may be absorbing the bulk of the operational drag, as the drop in revenue did not translate into a proportionate expansion in losses compared to the prior year period where revenue was nil. The presence of any operational income in Q1FY27, albeit small, marks a departure from the zero-revenue position seen in Q1FY26.
Historical Stock Returns for Miven Machine Tools
| 1 Day | 5 Days | 1 Month | 6 Months | 1 Year | 5 Years |
|---|---|---|---|---|---|
| 0.0% | 0.0% | +25.91% | +25.14% | 0.0% | 0.0% |

What specific operational or strategic initiatives is Miven Machine Tools pursuing to stabilize revenue streams following the sharp QoQ decline from ₹17.10 lakh to ₹3.00 lakh?
How does the company plan to address the persistent net losses, given that fixed costs appear to be the primary driver of the financial deficit despite marginal YoY improvement?
Are there any pending orders or new contracts expected in Q2FY27 that could reverse the trend of low operational income observed in Q1FY27?
 16
16






 Access Market Heat-map & Insights
  Create, Save & Share your Screener
  Use 200+ Screening Filters





