

Mahindra & Mahindra Auto Sales Rise 26% to 1,03,860 Units in July 2026


Mahindra & Mahindra reported a 26% year-on-year increase in total vehicle sales to 1,03,860 units in July 2026, exceeding the street estimate of 1,03,400 units. Growth was broad-based, with domestic UV sales up 20% to 60,048 units, tractor sales rising 21% to 32,643 units, three-wheeler sales surging 53% to 14,538 units, and Trucks & Buses combined sales growing 19% to 3,009 units.



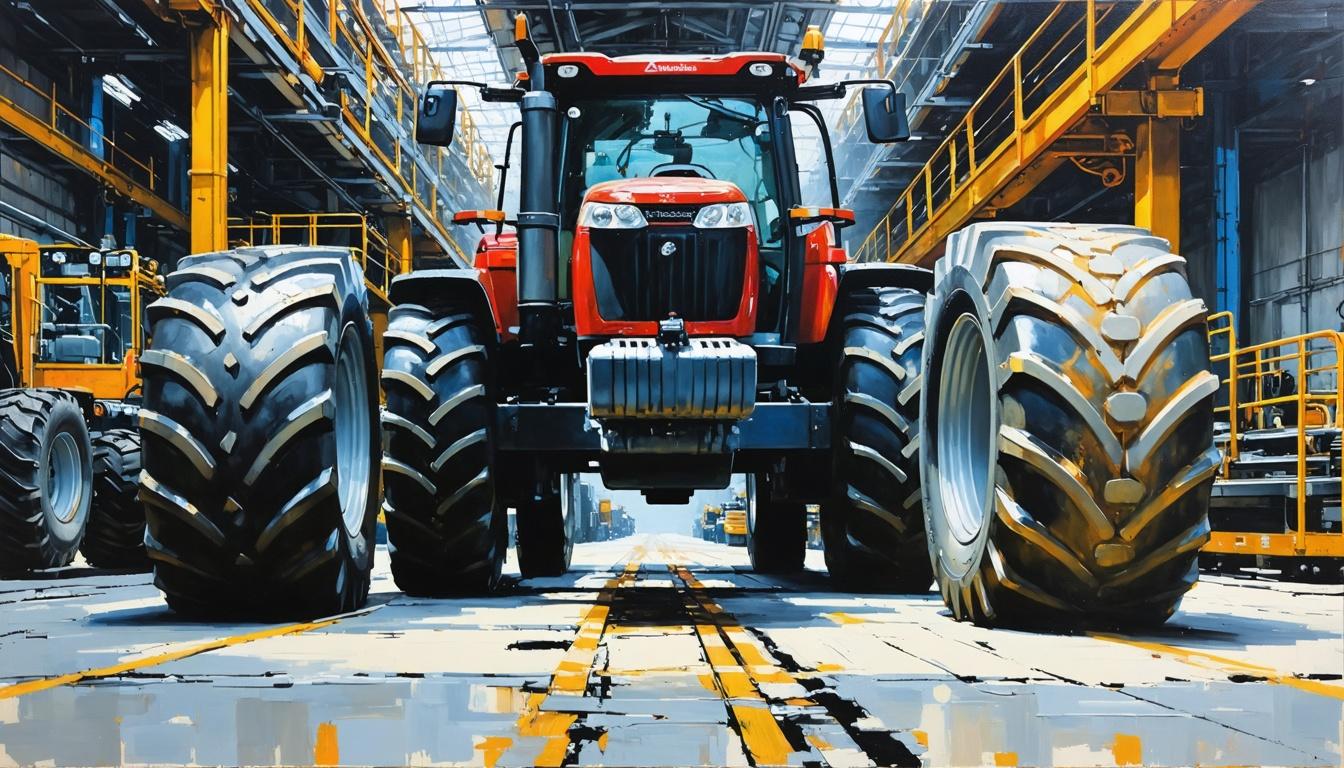
*this image is generated using AI for illustrative purposes only.
Mahindra & Mahindra Limited reported a robust 26% year-on-year increase in total vehicle sales to 1,03,860 units in July 2026, beating the street estimate of 1,03,400 units, driven by strong domestic demand for utility vehicles and a recovery in rural sentiment boosting tractor sales. The company filed the results with the National Stock Exchange of India Limited and BSE Limited on August 01, 2026. This broad-based growth underscores strengthening consumer confidence and commercial activity across India.
Utility Vehicles and Commercial Vehicles
The Utility Vehicles segment remained the primary growth engine, recording domestic sales of 60,048 units, up 20% from 49,871 units in July 2025. Including exports, overall UV sales stood at 60,887 units. Nalinikanth Gollagunta, CEO of the Automotive Division at Mahindra & Mahindra Limited, attributed the performance to "all-round demand traction across the portfolio."
Commercial vehicle sales also expanded significantly. Light commercial vehicles (LCV) under 2 tonnes surged 40% to 3,870 units, while LCVs between 2 tonnes and 3.5 tonnes rose 21% to 21,334 units. Three-wheeler sales recorded a notable surge of 53% to 14,538 units, indicating strengthening commercial activity alongside consumer demand. Total exports for the automotive division grew 47% to 4,070 units.
Farm Equipment Business
In the Farm Equipment Business, domestic tractor sales climbed 21% to 32,643 units compared to 26,990 units in the previous year. Total tractor sales, including exports, reached 34,420 units versus 28,708 units in the year-ago period, a 20% increase. Exports specifically rose 3% to 1,777 units. Veejay Nakra, President of the Farm Equipment Business, cited improved reservoir levels, accelerated kharif sowing, and healthy farm cashflows as key drivers for the positive rural sentiment.
Trucks and Buses
The Trucks and Buses business, comprising Mahindra Trucks & Buses division (MTBD) and SML Mahindra Limited, reported combined sales of 3,009 vehicles, a 19% year-on-year growth. MTBD alone saw a 27% jump in sales to 1,406 units, while SML Mahindra Limited recorded a 12% increase to 1,603 units. Vinod Sahay, Executive Chairman of SML, noted that infrastructure investment and rising freight demand are positioning the sector for sustained growth despite cost headwinds.
Segment-wise Sales Performance
The following table summarises the key sales metrics across segments for July 2026 compared to July 2025:
| Category: | July 2026 | July 2025 | YoY Change |
|---|---|---|---|
| Total Auto Sales | 1,03,860 | 78,969 | 26% |
| Auto Sales Estimate | 1,03,400 | — | — |
| Domestic UV Sales | 60,048 | 49,871 | 20% |
| Total UV Sales (incl. exports) | 60,887 | — | — |
| Tractor Sales (Domestic) | 32,643 | 26,990 | 21% |
| Total Tractor Sales (incl. exports) | 34,420 | 28,708 | 20% |
| Trucks & Buses (Total) | 3,009 | 2,534 | 19% |
| Three-Wheeler Sales | 14,538 | 9,475 | 53% |
| LCV (under 2 tonnes) | 3,870 | 2,763 | 40% |
What the Numbers Show
The data indicates a broad-based recovery rather than isolated segment strength. While UVs continue to dominate volume growth, the significant surge in three-wheeler and LCV sales suggests strengthening commercial activity alongside consumer demand. The alignment between rising tractor sales and improved agricultural indicators points to a genuine revival in rural purchasing power, supported by better rainfall and government initiatives. Total auto sales of 1,03,860 units also surpassed the market estimate of 1,03,400 units, reflecting demand momentum ahead of expectations.
Historical Stock Returns for Mahindra & Mahindra
| 1 Day | 5 Days | 1 Month | 6 Months | 1 Year | 5 Years |
|---|---|---|---|---|---|
| -3.05% | -5.77% | -14.22% | -3.21% | -16.55% | +256.14% |

Will the current surge in rural sentiment and tractor sales sustain through the upcoming Rabi sowing season, or is it primarily driven by temporary rainfall factors?
How might rising input costs and potential tariff changes impact Mahindra's margins in the high-growth Utility Vehicle segment?
Could the 47% jump in automotive exports indicate a strategic shift in market focus, and which new international regions are being prioritized?
 18
18












 Create Custom Screeners
  Access 200+ Pre-built Filters
  Use 50+ Readymade Screener





