

KP Energy FY26 Results: Revenue up 57% to ₹1,506 crore, PAT at ₹181 crore


- KP Energy posted record consolidated total income of ₹1,506 Crores in FY26, up 57% YoY, with PAT rising 57% to ₹181 Crores
- EBITDA surged 68% to ₹328 Crores with margin expanding to 22% from 20% in FY25; cash profit grew 72% to ₹239 Crores
- EPCC segment revenue grew 59% YoY to ₹1,452 Crores; executable order book expanded to 2.16+ GW
- Major IPP wins include 100 MW SECI project at ₹3.67/unit and 100 MW GUVNL project; CERC inter-state trading licence received
- Total FY26 dividend stands at ₹0.90 per share (18%); 17th AGM scheduled for September 29, 2026

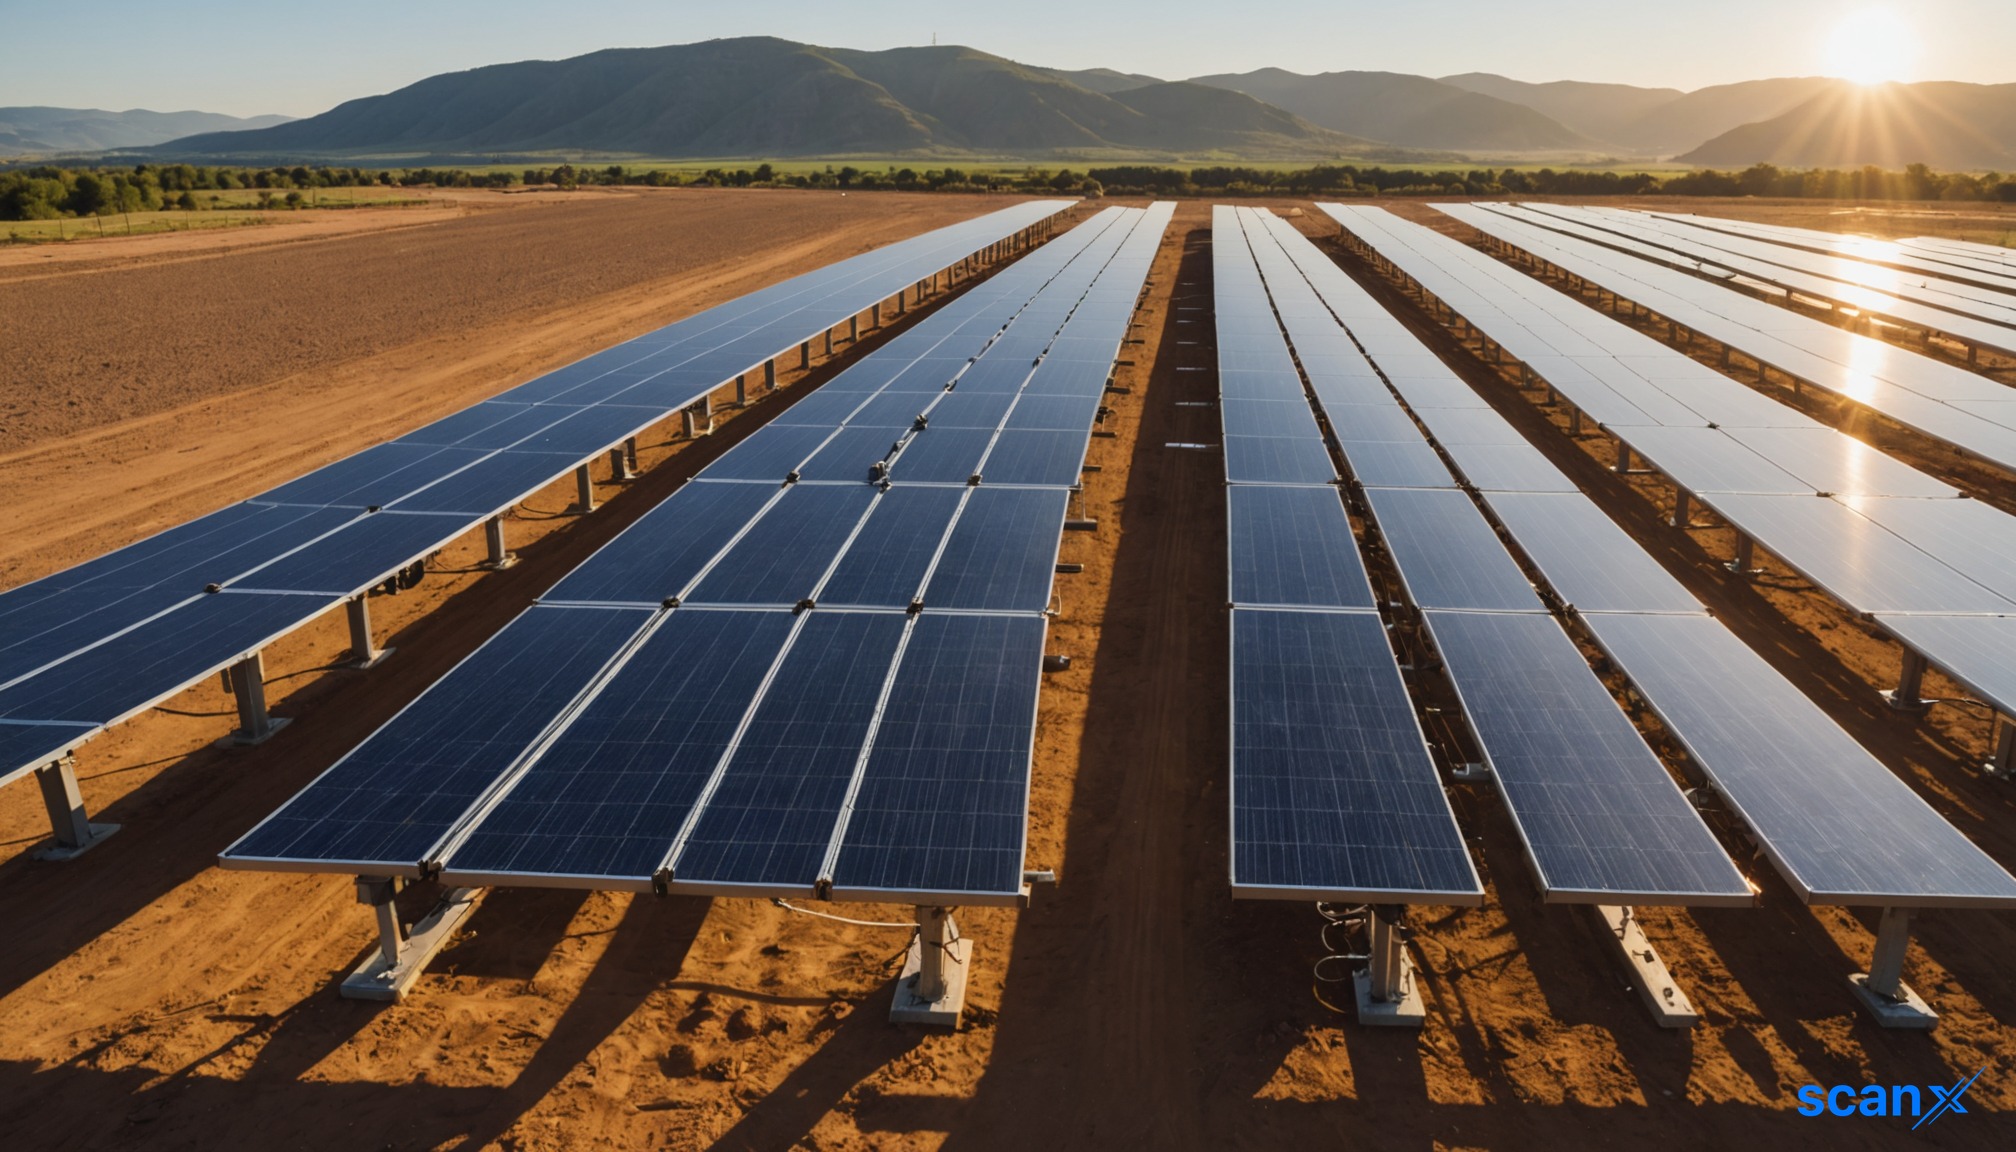

*this image is generated using AI for illustrative purposes only.
KP Energy Limited delivered its strongest-ever financial performance in FY26, with consolidated total income rising 57% YoY to ₹1,506 Crores and Profit After Tax reaching a record ₹181 Crores.
The Gujarat-headquartered wind and hybrid renewable energy solutions provider also filed its Annual Report and Notice for the 17th Annual General Meeting scheduled for September 29, 2026, through Video Conferencing/Other Audio-Visual Means. The cut-off date for e-voting eligibility is September 22, 2026.
FY26 Financial Performance
KP Energy's consolidated results showed broad-based growth across all key metrics, with EBITDA margin expanding from 20% in FY25 to 22% in FY26.
| Metric | FY26 | FY25 | YoY Change |
|---|---|---|---|
| Total Income | ₹1,506 Crores | ₹958 Crores | +57% |
| Revenue from Operations | ₹1,497 Crores | ₹939.05 Crores | +59% |
| EBITDA | ₹328 Crores | ₹196 Crores | +68% |
| EBITDA Margin | 22% | 20% | +200 bps |
| Profit After Tax | ₹181 Crores | ₹115 Crores | +57% |
| Cash Profit | ₹239 Crores | — | +72% |
| Earnings Per Share (Basic) | ₹27.07 | ₹17.29 | +56.6% |
| Net Worth | ₹522 Crores | — | +67% |
The EPCC segment, which accounts for 97% of revenue, delivered 59% YoY growth to ₹1,452 Crores. During FY26, CARE Ratings upgraded KP Energy's credit rating by two full notches from BBB to A- (Stable).
Standalone Financial Results
On a standalone basis, revenue from operations rose 61% YoY to ₹1,487.55 Crores from ₹926.55 Crores, while standalone EBITDA grew 70% to ₹325.70 Crores. Standalone PAT increased 60% to ₹179.86 Crores, with basic EPS of ₹26.84.
Key Order Wins and Business Milestones
FY26 was marked by several strategic developments across all three business verticals:
IPP Segment:
- 100 MW ISTS-connected wind power project from Solar Energy Corporation of India (SECI) at a tariff of ₹3.67/unit under a 25-year PPA
- Letter of Intent from Gujarat Urja Vikas Nigam Limited (GUVNL) for 100 MW wind project at ₹3.44/unit for 50 MW base capacity and ₹3.43/unit for the balance 50 MW under a 25-year framework
EPC Segment:
- 99 MW turnkey wind EPC contract from Inox Renewable Solutions in Gujarat
- 40.8 MW wind-solar hybrid EPC project from Enerparc Energy in Gujarat
- 91.4 MW wind-solar hybrid EPC contract from JK Paper, including long-term O&M services
The company also received a Category-V Inter-State Electricity Trading Licence from the Central Electricity Regulatory Commission (CERC), enabling pan-India power market participation. KP Energy became the first company in South Gujarat to install India's first 'Make in India' 4.2 MW-160 wind turbine.
Project Pipeline and Portfolio
| Parameter | Status |
|---|---|
| Executable Order Book | 2.16+ GW |
| Total Renewable Energy Portfolio | 3.73+ GW |
| Cumulative Capacity Installed (EPCC) | 1.57+ GW |
| O&M Portfolio | 646+ MW |
| Operational IPP Capacity | 48.5 MW |
| IPP Under Execution | 200 MW |
| Total IPP Portfolio | 248.5 MW |
| IPP Units Generated (FY26) | 9.5 crore kWh |
Five-Year Financial Trend
The following table illustrates KP Energy's consolidated financial trajectory:
| Fiscal Year | Total Income (₹ Crores) | PAT (₹ Crores) | EBITDA (₹ Crores) | EBITDA Margin (%) |
|---|---|---|---|---|
| FY22 | 254 | 18 | 37 | 15 |
| FY23 | 442 | 44 | 76 | 17 |
| FY24 | 486 | 58 | 99 | 20 |
| FY25 | 958 | 115 | 196 | 20 |
| FY26 | 1,506 | 181 | 328 | 22 |
Dividend and AGM Details
The Board has recommended a final dividend of ₹0.25 (5%) per equity share of face value ₹5 each for FY26, subject to shareholder approval at the AGM. Interim dividends aggregating ₹0.65 (13%) per share were already paid during the year, bringing the total FY26 dividend to ₹0.90 (18%) per equity share. The total cash outflow on account of dividends for FY26 amounts to ₹605.77 lakhs.
The 17th AGM is scheduled for September 29, 2026 at 11:30 a.m. IST via VC/OAVM. Key resolutions include appointment of M S K C & Associates LLP as Statutory Auditors for five years from the 17th AGM to the 22nd AGM, appointment of Prof. Sunil Kumar Maheshwari as Vice Chairman and Whole Time Director for five years effective July 3, 2026, and ratification of cost auditor remuneration of ₹50,000 for FY 2026-27.
Key Financial Ratios
| Ratio | FY26 | FY25 | Change |
|---|---|---|---|
| Debtors Turnover | 6.07 | 3.19 | +90.61% |
| Inventory Turnover | 1.33 | 4.08 | -67.28% |
| Interest Coverage Ratio | 7.49 | 8.85 | -15.35% |
| Current Ratio | 1.20 | 1.37 | -12.55% |
| Debt Equity Ratio | 0.76 | 0.74 | +1.81% |
| Operating Profit Margin | 21.33% | 18.84% | +13.21% |
| Net Profit Margin | 12.09% | 12.10% | -0.04% |
| Return on Equity | 34.59 | 36.67 | -5.69% |
Historical Stock Returns for KP Energy
| 1 Day | 5 Days | 1 Month | 6 Months | 1 Year | 5 Years |
|---|---|---|---|---|---|
| -2.49% | -4.83% | -6.36% | -40.22% | -51.08% | -63.16% |

How will the new Category-V Inter-State Electricity Trading Licence impact KP Energy's revenue diversification beyond its dominant EPCC segment in the coming fiscal year?
What are the execution risks associated with converting the 2.16+ GW executable order book into recognized revenue, given the recent decline in inventory turnover?
Will the expansion of the IPP portfolio to 248.5 MW significantly alter the company's capital expenditure requirements and debt equity ratio in FY27?
 15
15










 Create Custom Screeners
  Access 200+ Pre-built Filters
  Use 50+ Readymade Screener





