

Jinkushal Industries Q1FY26 net profit falls 66% to ₹220 lakh


Jinkushal Industries reported a consolidated net profit of ₹220.05 lakh for Q1FY26, down 66% YoY, despite a 16% rise in revenue to ₹5,656.55 lakh. Standalone net profit fell 12% to ₹330.94 lakh. The company incorporated a new subsidiary in Abu Dhabi.


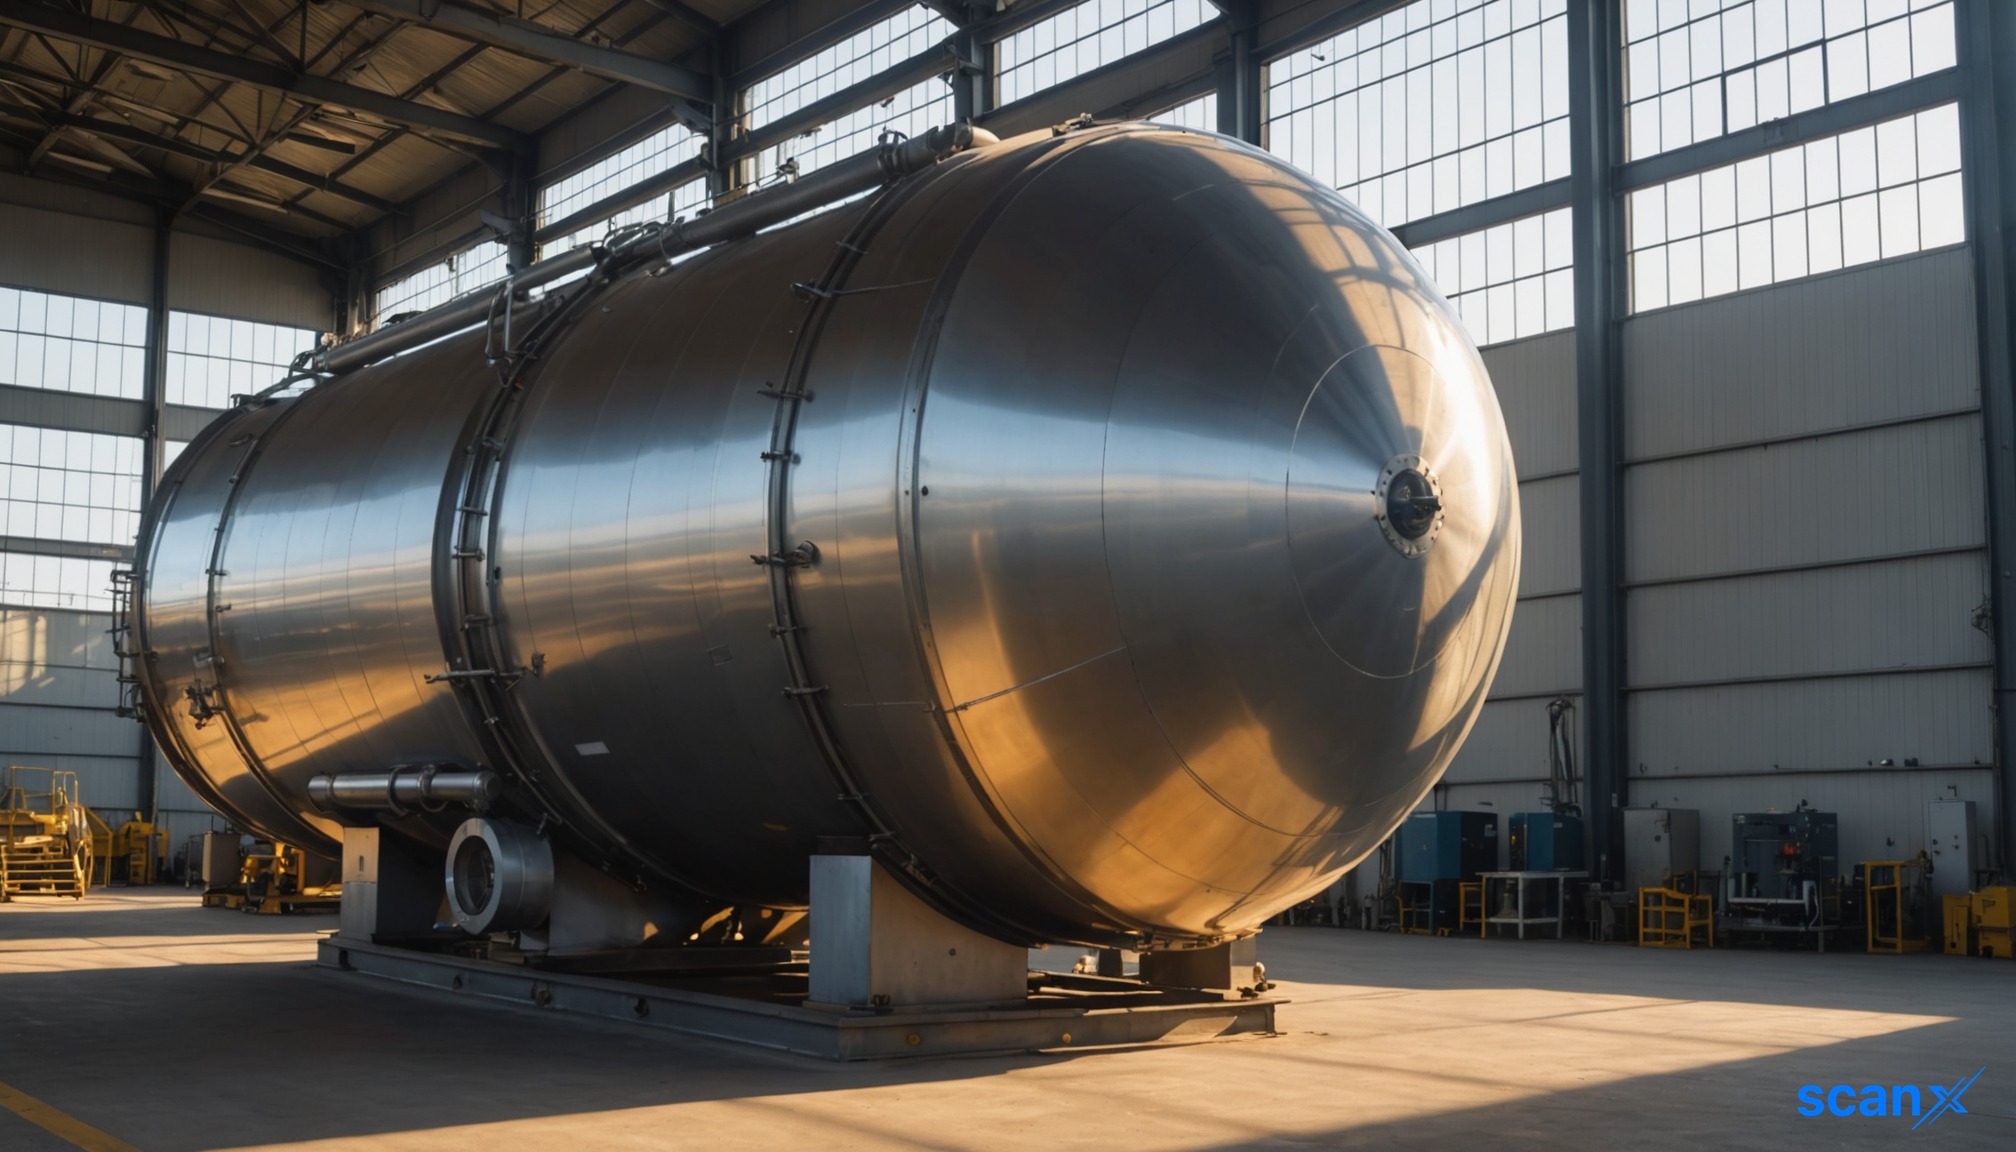
*this image is generated using AI for illustrative purposes only.
Jinkushal Industries reported a consolidated net profit of ₹220.05 lakh for the quarter ended June 30, 2026 (Q1FY26), marking a significant decline from the ₹650.56 lakh recorded in the same period last year. The drop represents a 66% fall compared to the previous quarter’s profit of ₹1,167.36 lakh, which included balancing figures from the audited FY26 results.
Consolidated revenue from operations increased by 16% year-on-year to ₹5,656.55 lakh, up from ₹4,882.41 lakh in Q1FY25. This growth was primarily driven by a rise in the purchase of machines for trade and refurbishment, which surged to ₹8,593.58 lakh from ₹3,110.88 lakh in the prior year’s corresponding quarter. Despite the revenue uptick, operating margins contracted significantly, with the adjusted EBITDA margin falling to 14.12% from 17.92% in Q1FY25.
Financial Performance Overview
The company’s standalone results showed a similar trend of declining profitability despite revenue growth. Standalone net profit fell 12% year-on-year to ₹330.94 lakh, compared to ₹376.32 lakh in Q1FY25. Standalone revenue from operations rose 37% YoY to ₹5,129.42 lakh. The standalone net profit margin stood at 6.45%, down from 10.08% in the previous year.
| Metric | Consolidated Q1FY26 | Consolidated Q1FY25 | Change | Standalone Q1FY26 | Standalone Q1FY25 | Change |
|---|---|---|---|---|---|---|
| Revenue from Operations (₹ lakh) | 5,656.55 | 4,882.41 | +16% | 5,129.42 | 3,732.17 | +37% |
| Net Profit (₹ lakh) | 220.05 | 650.56 | -66% | 330.94 | 376.32 | -12% |
| Operating Margin (%) | 14.12% | 17.92% | -380 bps | 5.40% | 9.74% | -434 bps |
| Net Profit Margin (%) | 3.89% | 13.32% | -943 bps | 6.45% | 10.08% | -363 bps |
What the Numbers Show
A notable divergence exists between the company’s top-line growth and bottom-line performance. While revenue expanded substantially due to increased inventory purchases for trade, the net profit margin compressed sharply from 13.32% in Q1FY25 to 3.89% in Q1FY26 on a consolidated basis. This suggests that the current revenue mix involves lower-margin trading activities rather than high-margin manufacturing or services. Additionally, other income contributed ₹551.89 lakh to total consolidated revenue, accounting for nearly 9% of total revenue, highlighting a reliance on non-operational gains to support overall financial health.
Balance Sheet and Strategic Moves
The company’s interest service coverage ratio improved to 3.08 times in Q1FY26, up from 6.67 times in Q1FY25, indicating better ability to meet interest obligations from operating earnings. However, the debt service coverage ratio remains unreported for the current quarter.
In a strategic expansion move, Jinkushal Industries’ subsidiary, Hexco Global FZCO, incorporated Hexco Global Machines L.L.C. – S.P.C. in Abu Dhabi, UAE, in August 2026. With a paid-up capital of AED 100,000, this step-down subsidiary is yet to commence commercial operations and will be consolidated in subsequent reporting periods. The Board of Directors approved these unaudited financial results on August 14, 2026, following a limited review by statutory auditors Singhal & Sewak.
Historical Stock Returns for Jinkushal Industries
| 1 Day | 5 Days | 1 Month | 6 Months | 1 Year | 5 Years |
|---|---|---|---|---|---|
| -1.23% | -3.74% | -8.03% | +103.20% | -20.68% | -20.68% |

Will Jinkushal Industries adjust its business mix to reduce reliance on low-margin trading activities and restore consolidated EBITDA margins to previous levels?
How will the upcoming commercial operations of the new UAE subsidiary, Hexco Global Machines L.L.C., impact the company's revenue streams and geographic diversification strategy?
Given the sharp compression in net profit margins despite revenue growth, what specific cost-control measures or pricing strategies does management plan to implement in Q2FY26?
 20
20









 Access Market Heat-map & Insights
  Create, Save & Share your Screener
  Use 200+ Screening Filters





