Jindal SAW Limited Submits Business Responsibility & Sustainability Report for FY 2025-26


Jindal SAW Limited filed its BRSR for FY 2025-26 on May 07, 2026, disclosing a total workforce of 5,272 employees and 15,692 workers, with a turnover of Rs. 1,46,20,13,39,769 and net worth of Rs. 1,25,92,73,29,611. Total energy consumption was 2,15,19,197 GJ, with Scope 1 and Scope 2 GHG emissions of 16,04,449 and 2,24,730 metric tons of CO2 equivalent respectively. All plants operate under Zero Liquid Discharge, with total water consumption of 50,52,880 kilolitres. The company targets 22% renewable energy by 2030 and reported improved safety metrics, with employee LTIFR declining to 0.159 from 0.628 in FY 2024-25.

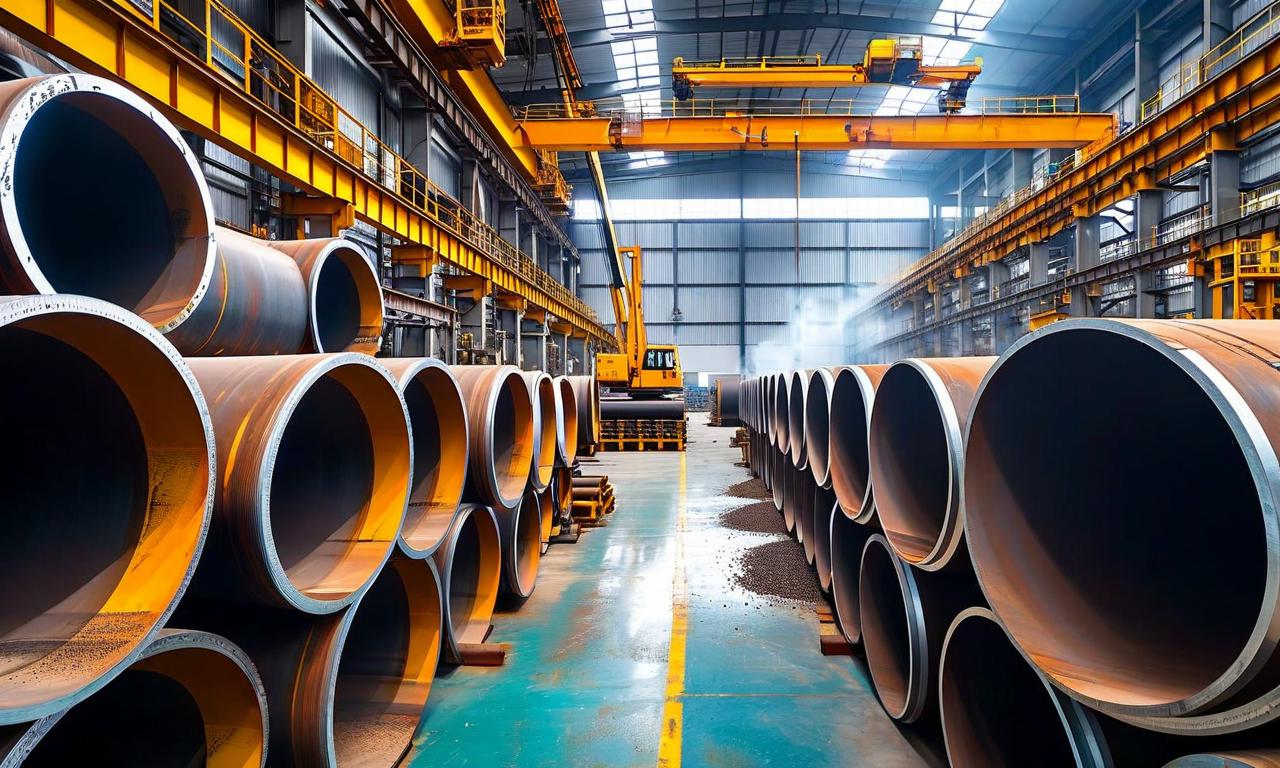
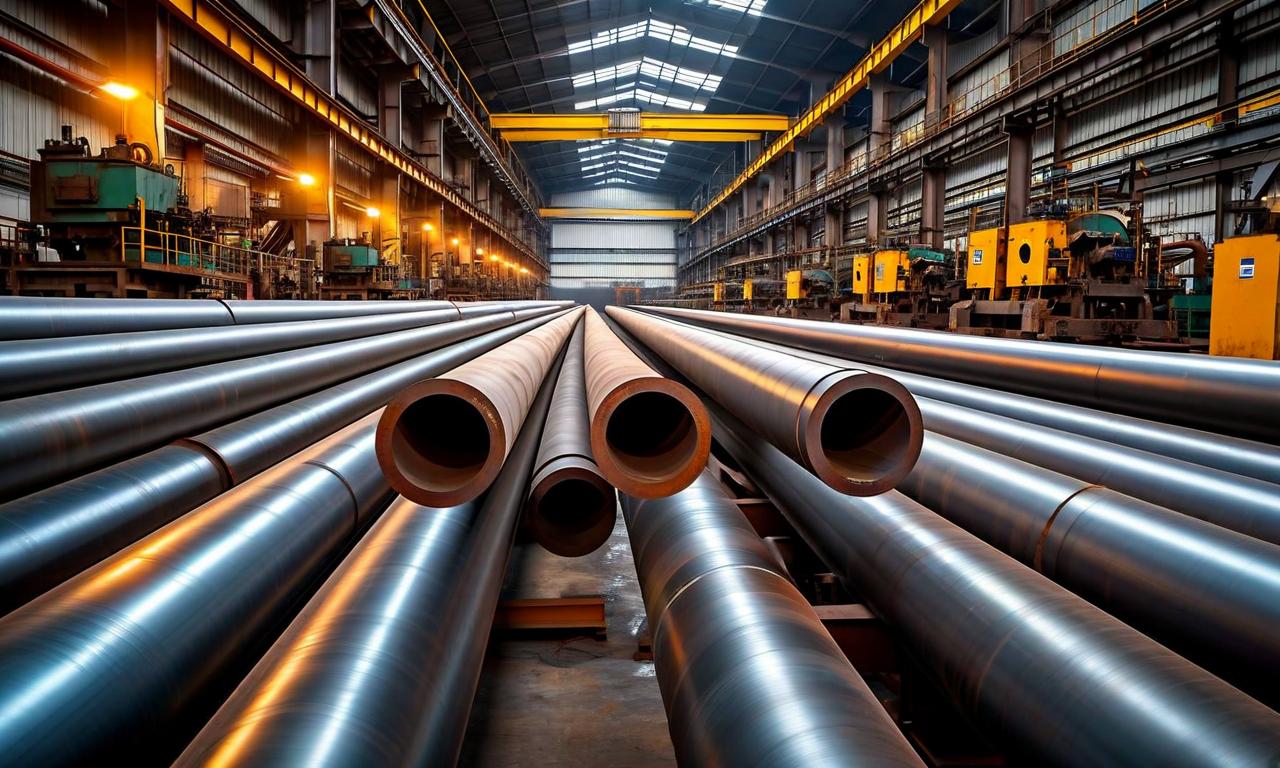
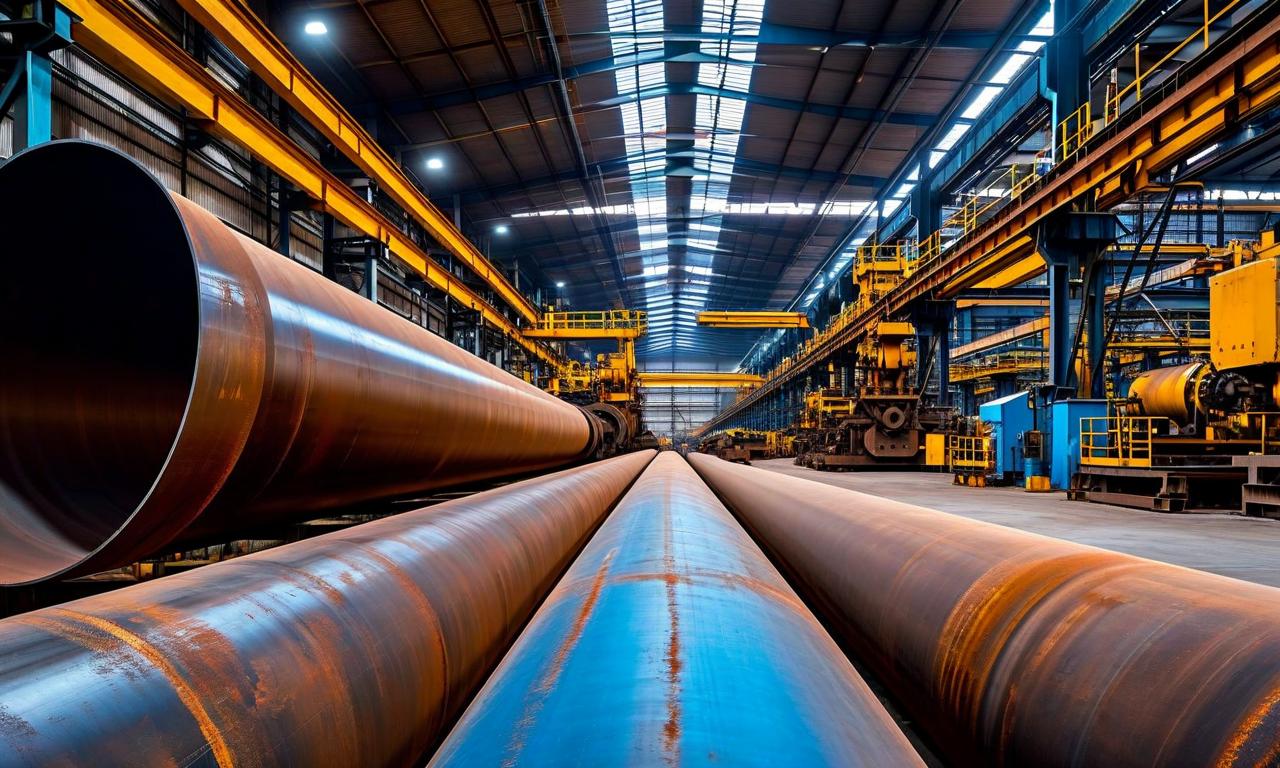
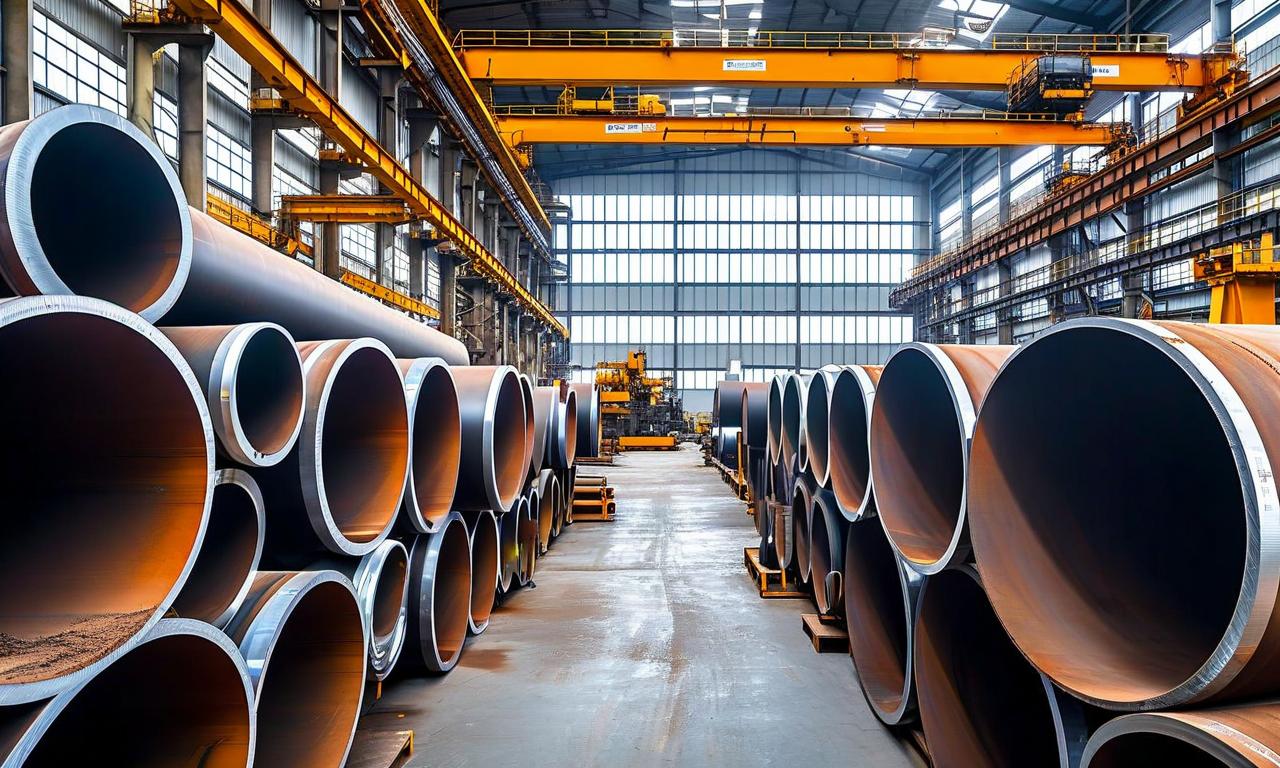
*this image is generated using AI for illustrative purposes only.
Jindal SAW Limited submitted its Business Responsibility and Sustainability Report (BRSR) for the financial year 2025-26 to BSE Limited and the National Stock Exchange of India Limited on May 07, 2026. The report was filed in compliance with Regulation 34(2)(f) of the SEBI (Listing Obligations & Disclosure Requirements) Regulations, 2015, and forms part of the company's Annual Report for FY 2025-26. The BRSR has been prepared on a standalone basis and includes a core assurance report conducted by Moore Singhi Advisors LLP, which provided reasonable assurance on the disclosures.
Company Overview and Financial Profile
Jindal SAW Limited, incorporated in 1984 and headquartered at Jindal Centre, 12, Bhikaji Cama Place, New Delhi-110066, is primarily engaged in the manufacturing and sale of iron and steel products, including pipes and allied accessories, as well as pellets. The company's registered office is located at A-1, Nandgaon Road, UPSIDC Industrial Area, Kosi Kalan, Mathura, Uttar Pradesh-281403.
The following table summarises key financial and corporate details as disclosed in the BRSR:
| Parameter: | Details |
|---|---|
| CIN: | L27104UP1984PLC023979 |
| Year of Incorporation: | 1984 |
| Paid-up Capital: | 81,05,04,434 |
| Turnover (in Rs.): | 1,46,20,13,39,769 |
| Net Worth (in Rs.): | 1,25,92,73,29,611 |
| Reporting Boundary: | Standalone |
| Assurance Provider: | Moore Singhi Advisors LLP |
| Type of Assurance: | Reasonable Assurance |
Iron and steel products (pipes and allied accessories) accounted for 90% of the company's turnover, while pellets contributed the remaining 10%. The company operates 12 plants and 13 offices nationally, along with one international office. It serves customers across 25 states in India and 30 countries internationally, with exports contributing 25.07% of total turnover.
Workforce and Employee Wellbeing
As of March 31, 2026, Jindal SAW's total workforce comprised 5,272 employees and 15,692 workers. The company's workforce composition is detailed below:
| Category: | Total | Male | Female |
|---|---|---|---|
| Permanent Employees: | 4,337 | 4,245 (97.9%) | 92 (2.1%) |
| Other than Permanent Employees: | 935 | 924 (98.8%) | 11 (1.2%) |
| Total Employees: | 5,272 | 5,169 (98.0%) | 103 (2.0%) |
| Permanent Workers: | 3,224 | 3,221 (99.9%) | 3 (0.1%) |
| Other than Permanent Workers: | 12,468 | 12,295 (98.6%) | 173 (1.4%) |
| Total Workers: | 15,692 | 15,516 (98.9%) | 176 (1.1%) |
The company reported 21 differently abled employees and 40 differently abled workers. Women's representation on the Board of Directors stood at 4 out of 12 members (33.33%), while 3 out of 6 Key Management Personnel (50%) were female. Wellbeing expenditure as a percentage of total revenue was 0.091% in FY 2025-26, compared to 0.083% in FY 2024-25.
The permanent employee turnover rate (total) was 9.9% in FY 2025-26, compared to 14.3% in FY 2024-25 and 10.7% in FY 2023-24. All permanent employees and workers were covered under PF and Gratuity, with deductions deposited with the relevant authorities.
Safety Performance
Jindal SAW reported improvements in key safety metrics during FY 2025-26. The Lost Time Injury Frequency Rate (LTIFR) for employees declined to 0.159 per one million person-hours worked from 0.628 in FY 2024-25. For workers, the LTIFR improved to 0.183 from 0.372 in the prior year. Total recordable work-related injuries for employees fell to 13 from 17, and for workers to 37 from 62. One worker fatality was recorded in FY 2025-26, compared to two in FY 2024-25. No employee fatalities or high-consequence injuries were reported in either year.
Environmental Performance
The company's energy and emissions data for FY 2025-26 reflects the following:
| Parameter: | FY 2025-26 | FY 2024-25 |
|---|---|---|
| Total Renewable Energy Consumed (GJ): | 3,50,468 | 2,24,735 |
| Total Non-Renewable Energy Consumed (GJ): | 2,11,68,729 | 2,21,15,494 |
| Total Energy Consumed (GJ): | 2,15,19,197 | 2,23,40,229 |
| Energy Intensity (GJ/MT): | 7.22 | 6.64 |
| Total Scope 1 Emissions (Metric Tons CO2e): | 16,04,449 | 19,07,378 |
| Total Scope 2 Emissions (Metric Tons CO2e): | 2,24,730 | 3,02,048 |
| Scope 1 & 2 Intensity (Metric Tons CO2e/MT): | 0.614 | 0.656 |
| Total Scope 3 Emissions (MtCO2e): | 76,802 | 97,436 |
Total water withdrawal and consumption was 50,52,880 kilolitres in FY 2025-26. All plants operate under a Zero Liquid Discharge (ZLD) mechanism, resulting in nil water discharge. The company has installed a 10 MLD Sewage Treatment Plant at Bhilwara to reduce dependence on freshwater sources. Key air emission parameters included NOx at 29.09 mg/Nm3, SOx at 32.76 mg/Nm3, and particulate matter at 36.33 mg/Nm3 for FY 2025-26.
Total waste generated was 1,38,86,459 metric tonnes in FY 2025-26, compared to 1,29,08,559 metric tonnes in FY 2024-25. Of this, 1,45,214 metric tonnes were recycled. The company has set a target to shift 22% of its total energy consumption to renewable sources by 2030.
Governance, Ethics, and Compliance
The BRSR covers all nine NGRBC principles, with Board-approved policies in place for eight of the nine principles. Independent assessment of policies was conducted by external agencies including S.K. Gupta and Co. and Deloitte Haskins and Sells LLP. The company reported monetary penalties totalling Rs. 6,47,037 from the Commissioner of Customs (11 cases related to BOE), Rs. 5,148 from the Central Board of Indirect Taxes and Customs (1 case related to CGST), and Rs. 15,000 from the Directorate of Factories (2 cases). No non-monetary penalties, settlements, or compounding fees were reported.
Accounts payable days stood at 69.78 in FY 2025-26, compared to 75.30 in FY 2024-25. Purchases from trading houses as a percentage of total purchases were 24.77% in FY 2025-26. No complaints related to bribery, corruption, or conflict of interest involving directors or KMPs were received in either FY 2025-26 or FY 2024-25.
CSR and Community Initiatives
Jindal SAW's CSR programme, Swayam, focuses on accessibility awareness and para-sports development. Key CSR projects include district-level para-sports talent identification camps, procurement and modification of 10 accessible vehicles, and education scholarships for students with disabilities. Community beneficiaries across various CSR projects included 1,50,000 persons from municipal park cleaning and maintenance activities, 5,00,000 from hospital housekeeping, and 975 from school renovation works, among others. The company is associated with eleven trade and industry chambers and associations, including ASSOCHAM, CII, PHD CCI, and international bodies such as IPLOCA (Switzerland) and the Australian Pipelines and Gas Association.
Historical Stock Returns for Jindal SAW
| 1 Day | 5 Days | 1 Month | 6 Months | 1 Year | 5 Years |
|---|---|---|---|---|---|
| +1.29% | +4.91% | +15.01% | +70.84% | +19.60% | +340.36% |
How does Jindal SAW plan to accelerate its renewable energy transition to meet the 22% target by 2030, and what capital investments will be required given that renewables currently account for less than 2% of total energy consumption?
With female workforce representation at just 2% among employees and 1.1% among workers, what specific diversity initiatives might regulators or institutional investors pressure Jindal SAW to implement in coming years?
Given that iron and steel pipe manufacturing faces increasing competition from alternative materials, how might Jindal SAW's export strategy across 30 countries evolve as global infrastructure spending patterns shift?
 17
17