

JBS Q2FY26 Results: Revenue hits record $24 billion, net loss widens


- Record Q2FY26 revenue of $24 billion offset by $102 million net loss due to non-recurring items
- Adjusted net income held steady at $218 million; adjusted EBITDA margin at 6%
- Strategic partnership secures $2.5 billion equity stake in Australia/New Zealand ops
- U.S. Beef margin improves to -1.3% from -3.9% YoY amid tight cattle supply
- Free cash flow rises $105 million YoY to $130 million via working capital optimization

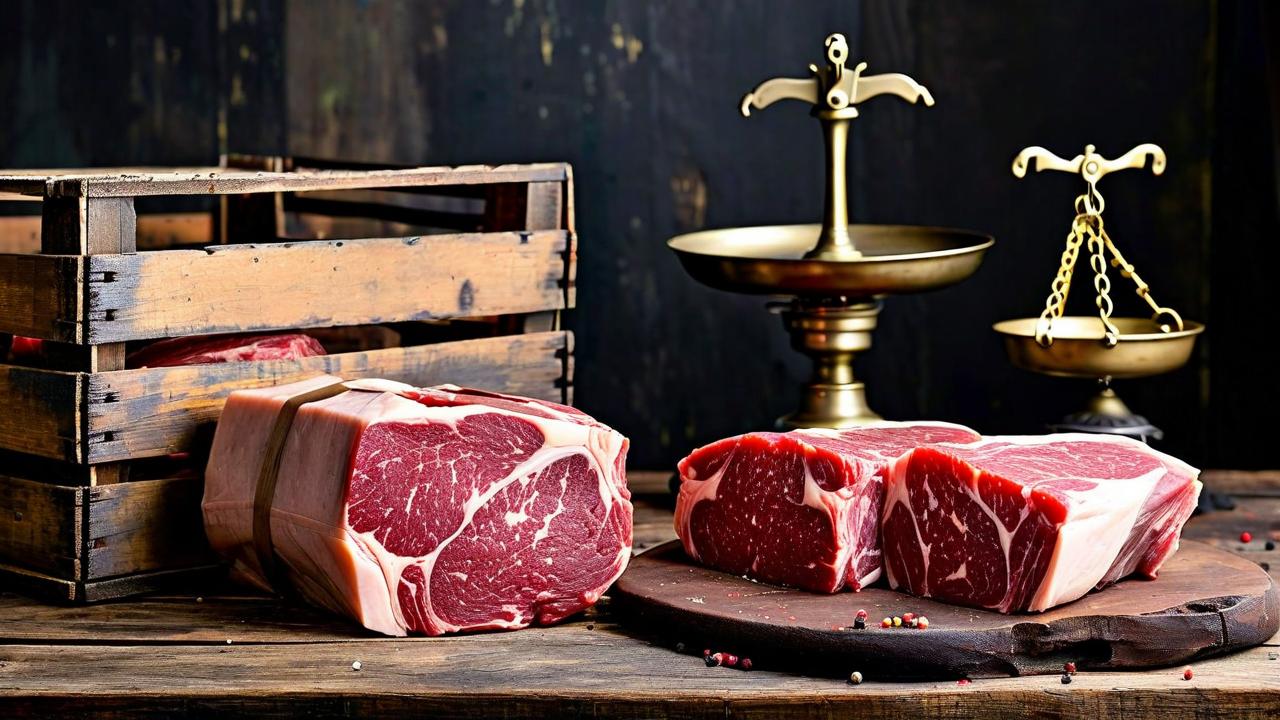

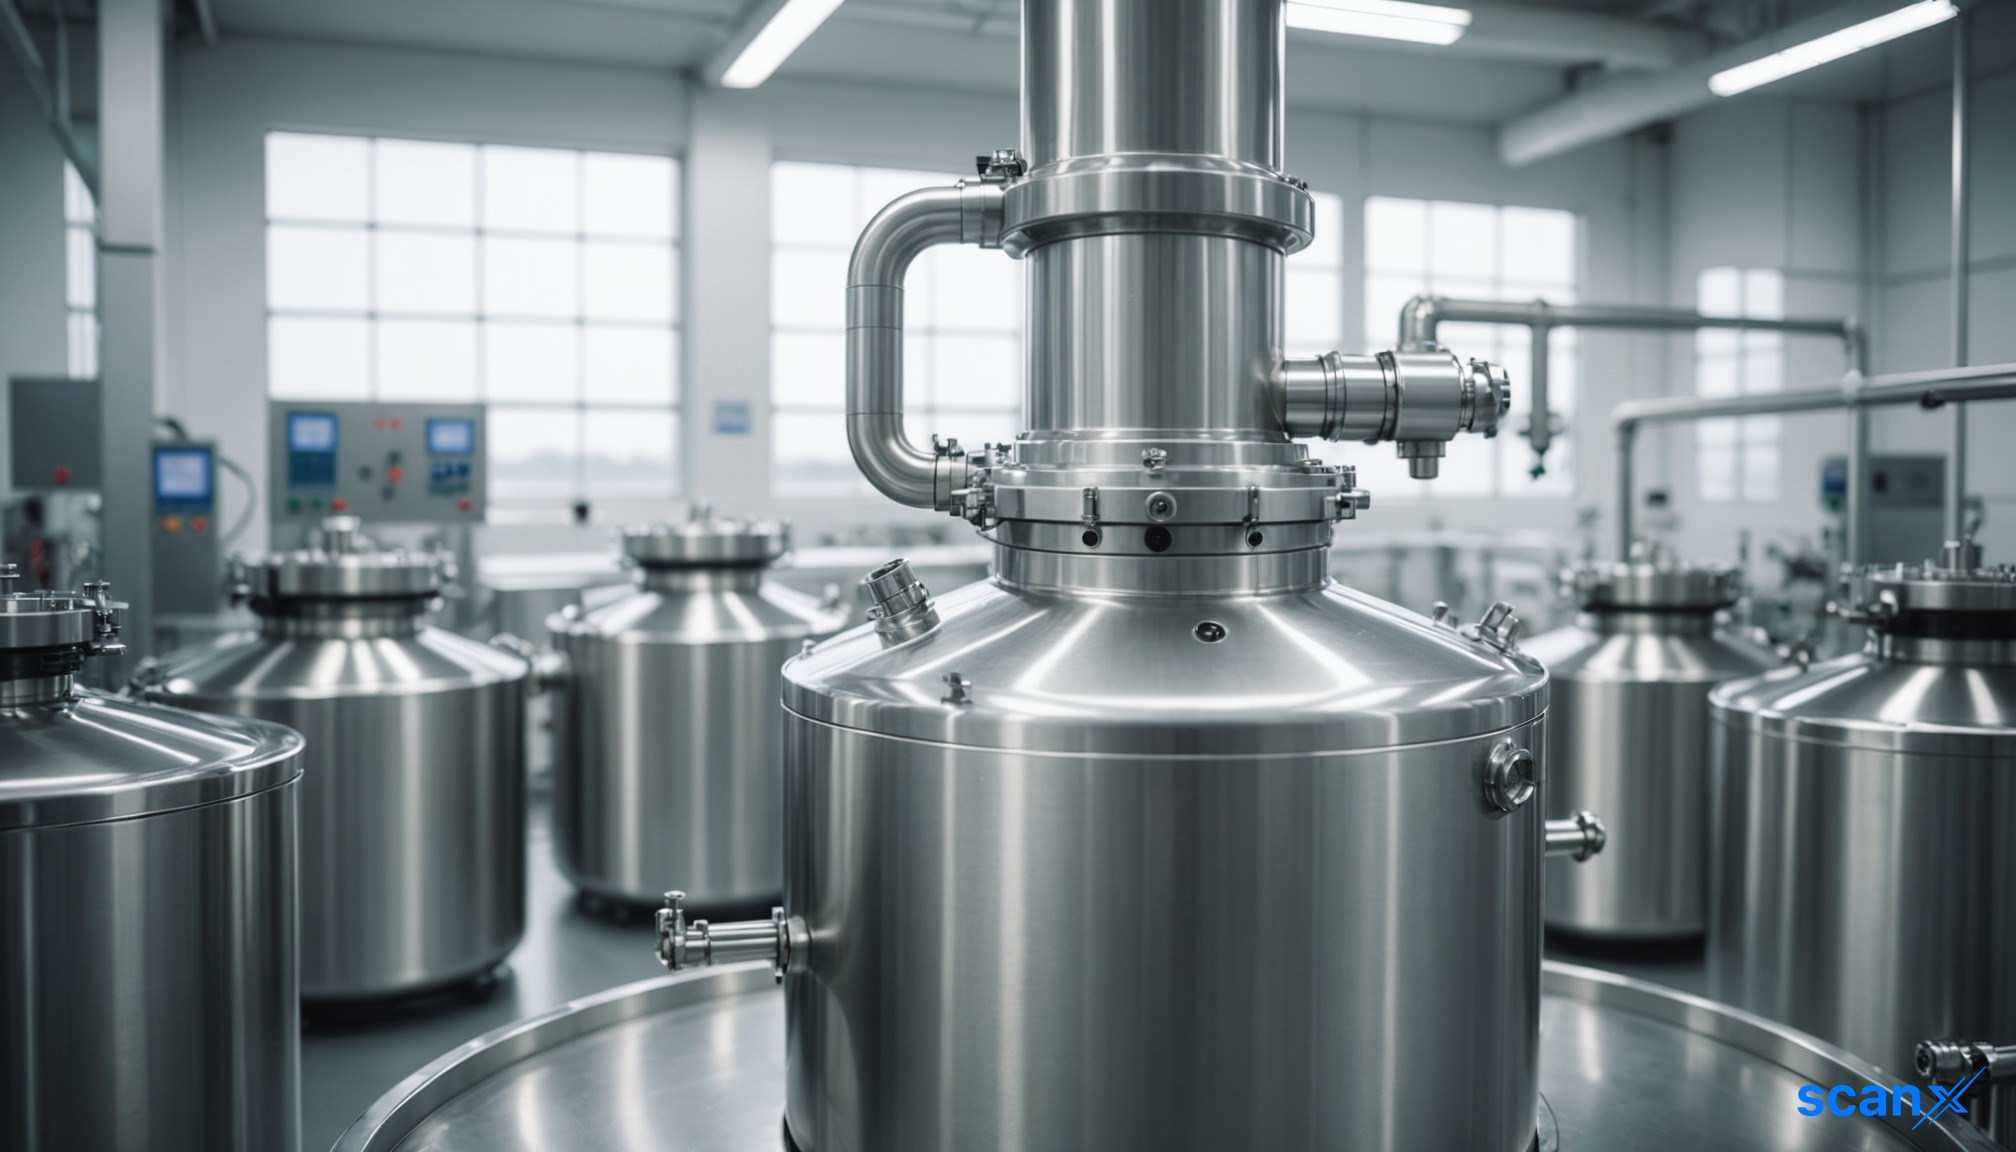
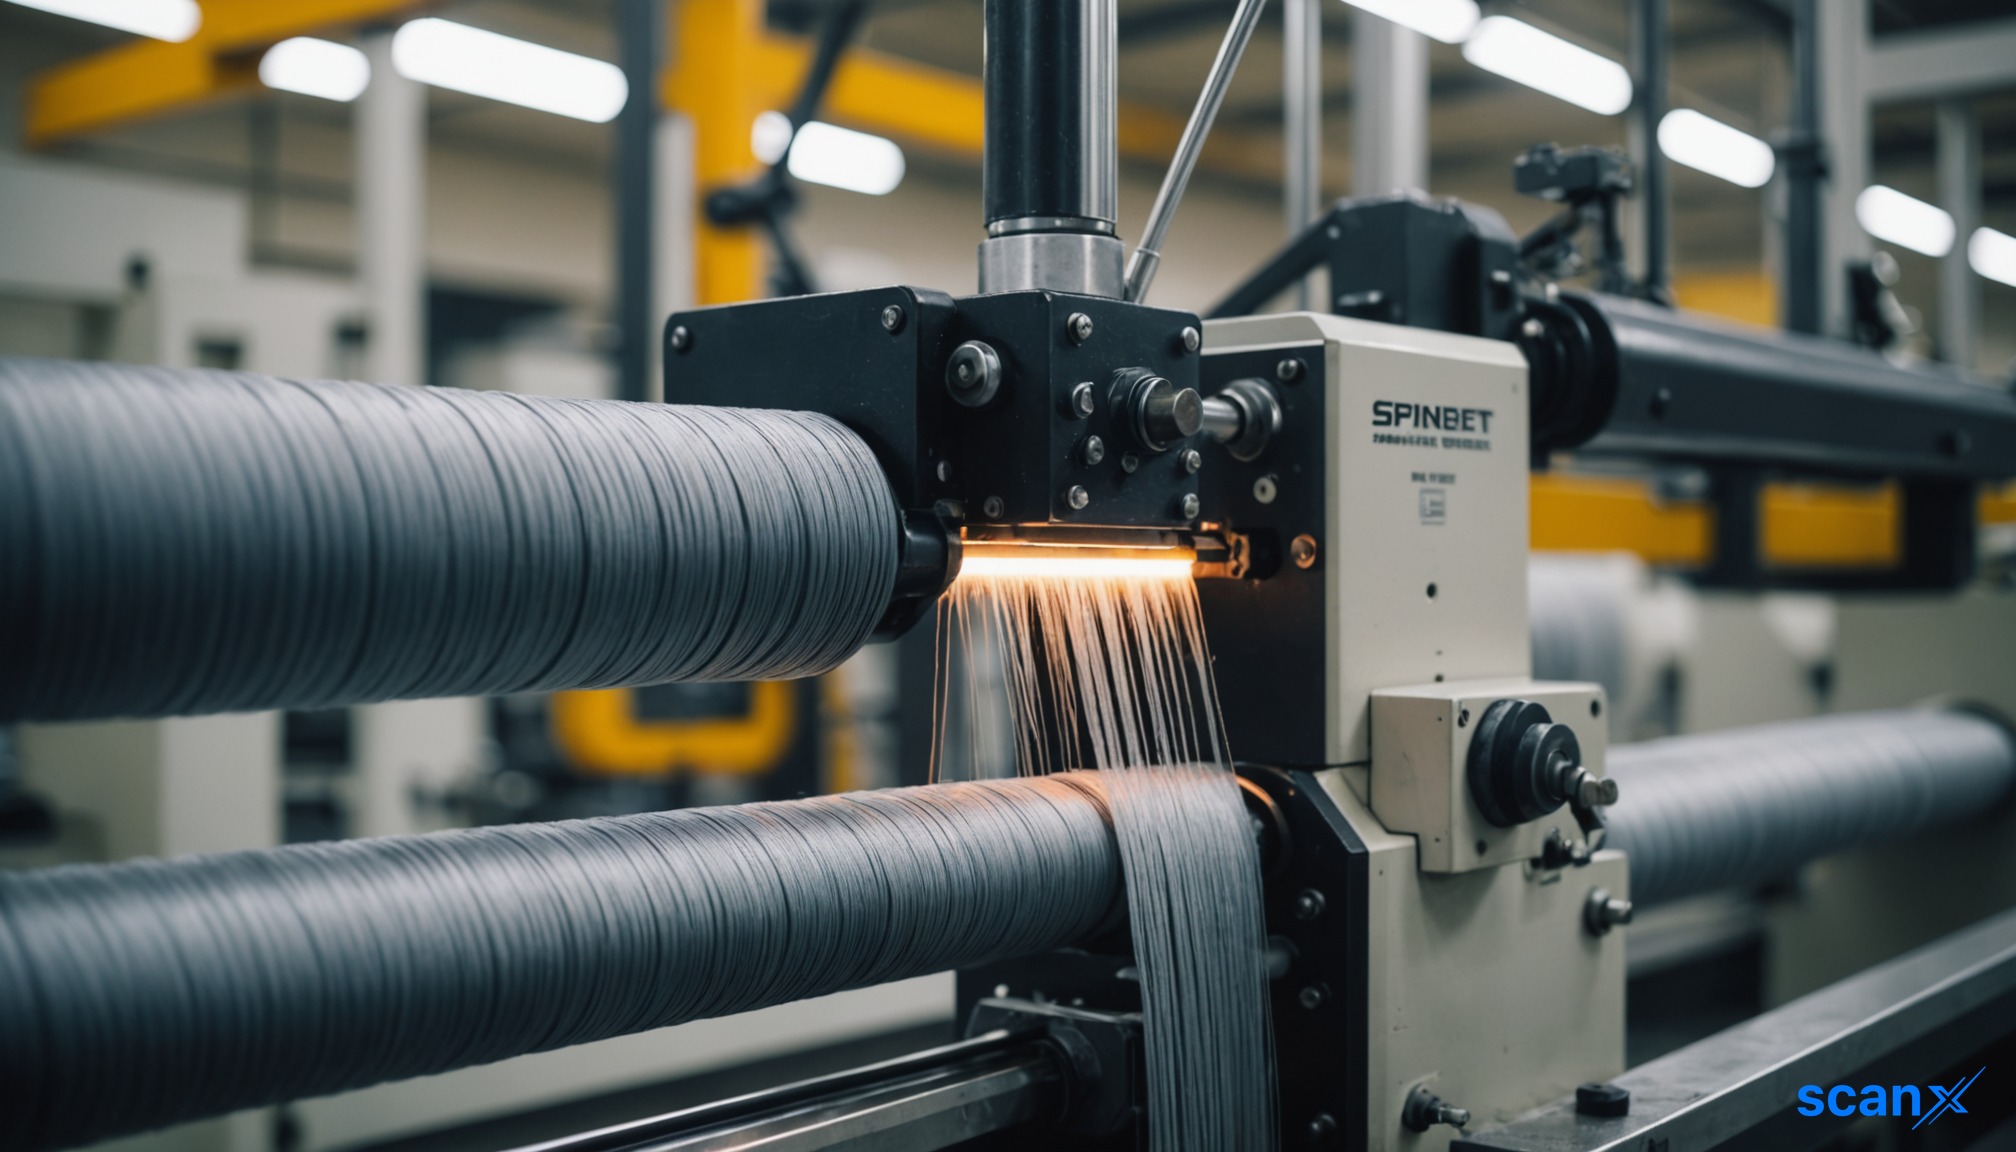
*this image is generated using AI for illustrative purposes only.
JBS N.V. (NYSE: JBS) reported a second-quarter net loss of $102 million against a record revenue of $24 billion. The reported loss was driven by significant non-recurring charges, while adjusted net income remained positive at $218 million.
The global protein processor announced a strategic partnership with Mantra Investment Management, securing a $2.5 billion equity investment for a 25% stake in its Australia and New Zealand operations. This deal aims to fund growth initiatives in Southeast Asia.
Financial Performance
JBS delivered its highest-ever quarterly sales, reflecting strong volume and pricing dynamics across key markets. However, profitability metrics diverged significantly between reported GAAP/IFRS figures and adjusted operational results.
| Metric | Q2FY26 Value | Margin / Context |
|---|---|---|
| Net Sales | $24 billion | Record high |
| Adjusted EBITDA (IFRS) | $1.43 billion | 6% margin |
| Adjusted Net Income | $218 million | Operational focus |
| Reported Net Loss | $102 million | Impacted by one-offs |
The reported net loss included a $319 million increase in net financial expenses. Key drivers were $172 million in costs related to the tender offer for bonds and Brazilian local debentures, alongside an $81 million bargain purchase gain adjustment from the Montrique Elementos acquisition and $133 million in antitrust settlements. Excluding these items, adjusted earnings per share reached $0.20.
Regional Operations
Brazil emerged as a standout performer, recording its highest-ever second-quarter EBITDA of $269 million (5.9% margin). This result was fueled by robust export demand, particularly to China, and disciplined commercial execution despite elevated cattle prices. The domestic business also benefited from strong performance in the barbecue portfolio and expanded retailer partnerships.
In contrast, the U.S. Beef segment continues to face headwinds from tight cattle supplies and historically high input costs. However, operational improvements helped narrow the EBITDA margin deficit to -1.3%, up from -3.9% in the prior year. U.S. Pork demonstrated resilience with an EBITDA margin expansion to 8.9% from 6.5% year-over-year, despite weaker demand in prepared foods.
Australia’s results improved amid challenging supply conditions caused by drought-related constraints on cattle availability. The upcoming joint venture with Mantra is expected to unlock up to $5 billion in funding capacity for acquisitions and greenfield projects in Indonesia and Southeast Asia.
What the Numbers Show
A critical divergence exists between JBS’s top-line momentum and its bottom-line pressure. While revenue hit a record $24 billion, adjusted EBITDA declined by $324 million year-over-year. This gap highlights that current profitability is being sustained by margin protection and efficiency gains rather than pure volume leverage. Furthermore, free cash flow improved by $105 million to $130 million, primarily due to working capital management—specifically higher receivable discounts and advanced payments from Chinese customers—offsetting the decline in operating cash generation.
Balance Sheet and Outlook
Free cash flow generation strengthened despite the drop in adjusted EBITDA, aided by lower tax payments of $135 million year-over-year. Total capital expenditures rose by $163 million, largely driven by expansion projects.
Net leverage ended the quarter at 3.1 times, slightly above the long-term target range of 2-3 times. The company highlighted that it has no significant debt maturities until 2031, with an average debt term of 15.3 years and an average cost of 5.7%. Management expects leverage to remain slightly elevated in the near term as it focuses on cash generation and disciplined capital allocation for the remainder of FY26.

How will the $2.5 billion Mantra Investment Management partnership specifically accelerate JBS's market share expansion in Indonesia and Southeast Asia?
What strategies is JBS implementing to mitigate the persistent headwinds of tight cattle supplies and high input costs in the U.S. Beef segment?
Given the net leverage ratio of 3.1x, what specific capital allocation priorities will JBS pursue to return to its 2-3x target range by the end of FY26?
 17
17





 Access Market Heat-map & Insights
  Create, Save & Share your Screener
  Use 200+ Screening Filters





