

IVP Q1FY27 Results: Net profit rises 1,078% YoY to ₹14.02 crore


- Net profit surged 1,078% YoY to ₹14.02 crore in Q1FY27
- Revenue grew 12% to ₹154.73 crore on stable demand
- EBITDA margin expanded 1,017 bps to 14.01% due to cost control
- Finance costs fell 35% YoY to ₹1.38 crore
- Debt-to-equity ratio stands at 0.42 times


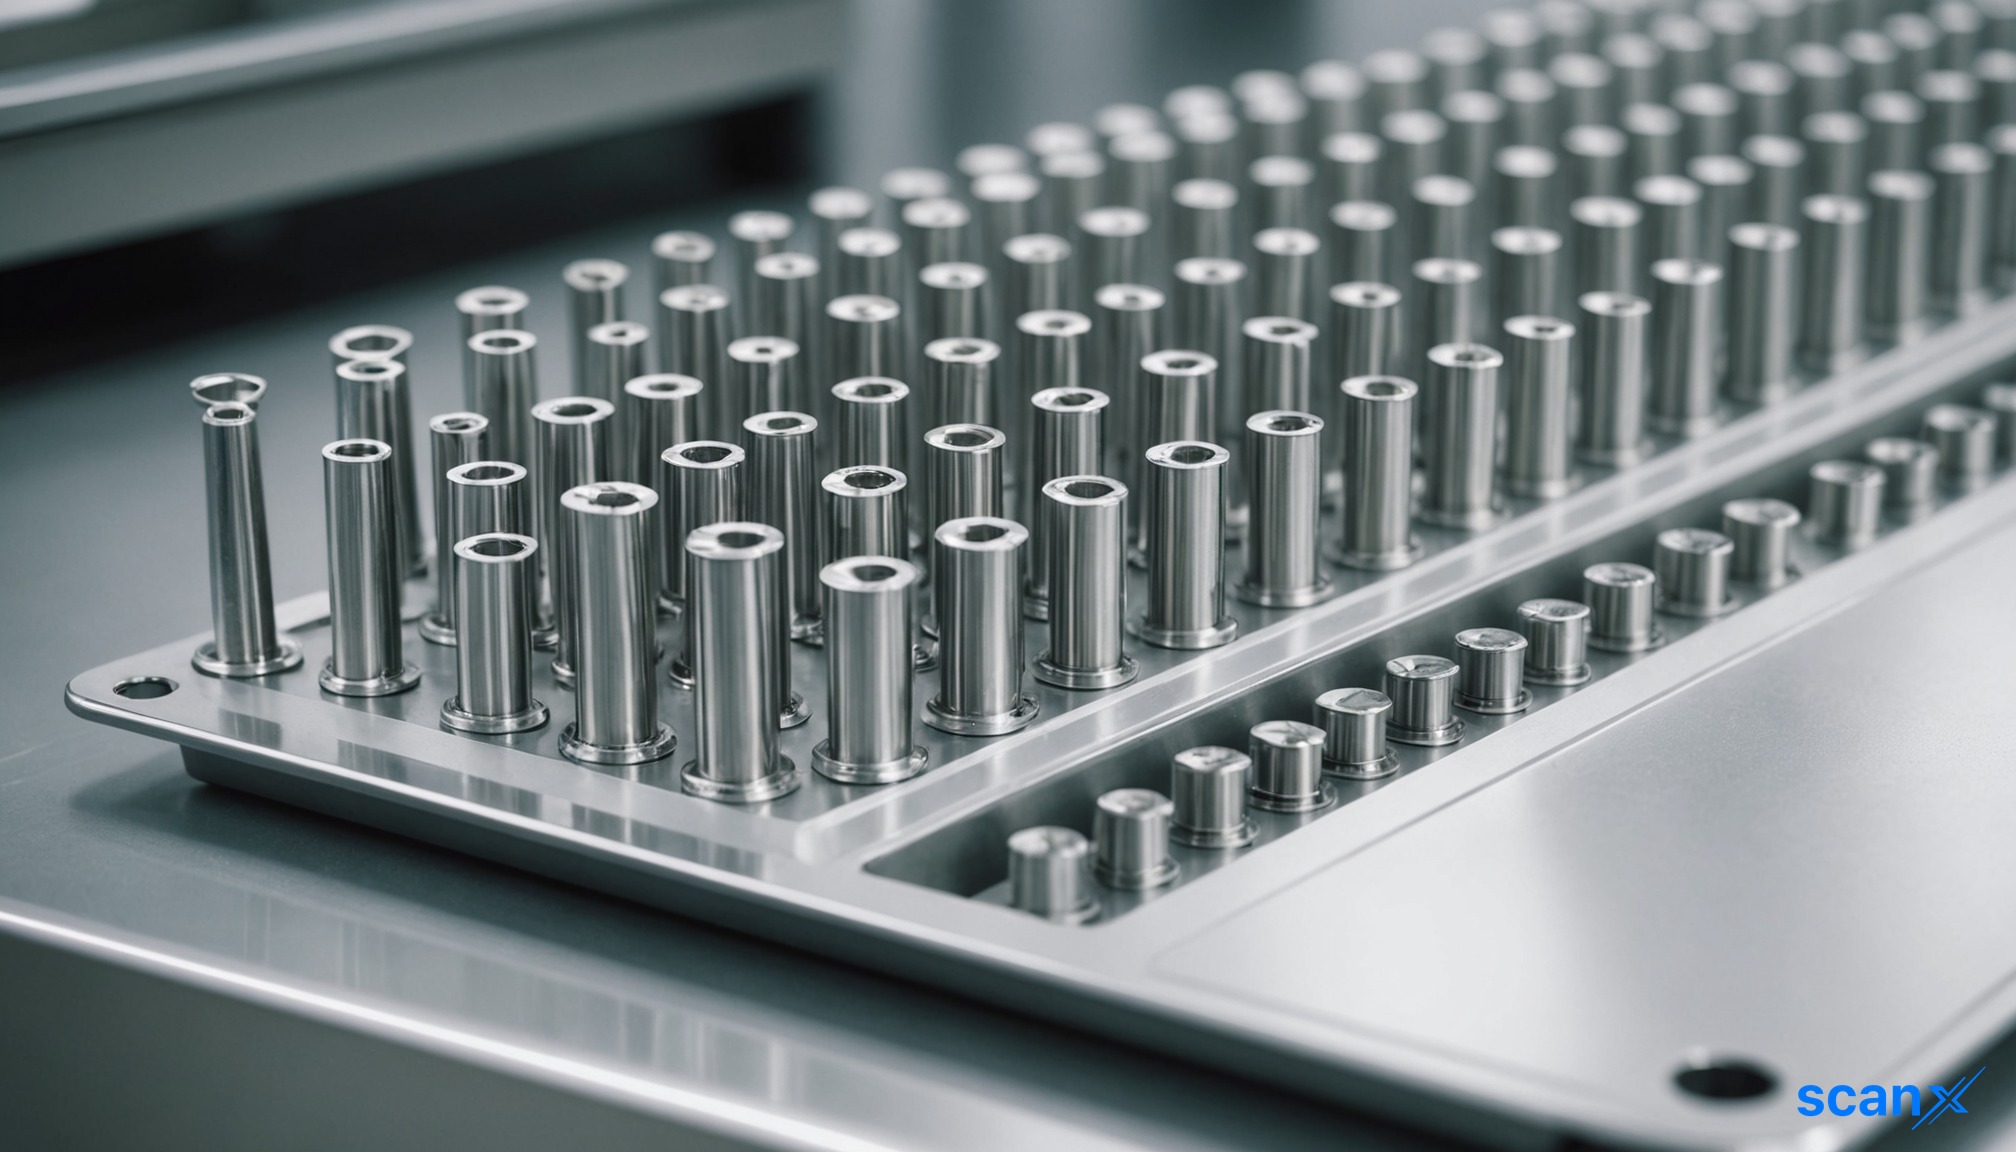
*this image is generated using AI for illustrative purposes only.
IVP Limited reported a 1,078% year-on-year surge in net profit for the first quarter of FY27, driven by improved product mix and operational efficiencies.
IVP Limited posted a net profit of ₹14.02 crore for the quarter ended June 30, 2026, compared to ₹1.19 crore in the corresponding period of FY26. Revenue from operations grew 12% to ₹154.73 crore.
Financial Performance
The company’s profitability expanded significantly as EBITDA margins widened by 1,017 basis points to 14.01%. This margin expansion occurred alongside modest top-line growth, indicating effective cost management.
| Metric | Q1FY27 | Q1FY26 | Change |
|---|---|---|---|
| Revenue | ₹154.73 crore | ₹138.19 crore | +12% |
| EBITDA | ₹21.68 crore | ₹5.31 crore | +308% |
| EBITDA Margin | 14.01% | 3.84% | +1,017 bps |
| Net Profit | ₹14.02 crore | ₹1.19 crore | +1,078% |
Profit before tax rose to ₹18.76 crore from ₹1.70 crore in the prior year quarter. Finance costs declined 35% to ₹1.38 crore, supporting the bottom-line improvement.
What the Numbers Show
The divergence between revenue growth (12%) and EBITDA growth (308%) highlights a structural shift in profitability rather than volume-driven expansion. With total operating expenses remaining flat at ₹134.14 crore despite higher revenue, the company successfully leveraged fixed costs to drive margin expansion.
Business Context
IVP operates in phenolic resins and polyurethane resins, serving foundry, footwear, and flexible packaging sectors. The footwear solutions segment contributes 60-65% of revenue, while foundry applications account for 30-40%.
Management cited better realizations and efficient raw material procurement as key drivers. The company maintains a debt-to-equity ratio of 0.42 times, reflecting a lean balance sheet strategy.
Outlook
The company remains focused on strengthening customer engagement and enhancing product mix to sustain margins. Strategic priorities include leveraging its diversified portfolio and improving operational efficiencies across the value chain.
Historical Stock Returns for IVP
| 1 Day | 5 Days | 1 Month | 6 Months | 1 Year | 5 Years |
|---|---|---|---|---|---|
| +0.15% | -1.81% | +20.82% | +67.50% | +28.77% | +85.38% |

Can the 1,017 basis point EBITDA margin expansion be sustained in Q2FY27, or is it primarily a one-time benefit from favorable raw material pricing?
How will the company allocate the increased cash flows given its already lean debt-to-equity ratio of 0.42x?
What specific operational efficiencies are driving the flat operating expenses despite a 12% revenue increase?






 Create Custom Screeners
  Access 200+ Pre-built Filters
  Use 50+ Readymade Screener





