

IRB Infrastructure Developers files FY26 BRSR report with ESG metrics


- IRB Infrastructure Developers filed its FY26 BRSR report covering consolidated ESG metrics
- Total energy consumption rose to 1,473,193.23 GJ while intensity per lane km fell to 82.06 GJ
- Scope 1 and 2 GHG emissions increased to 139,412.71 MT CO2e but intensity dropped to 7.77 MT/lane km
- Waste generated fell sharply to 281,757.36 MT with a 99.07% recovery rate
- Safety metrics improved with zero lost time injuries and fatalities recorded for FY26



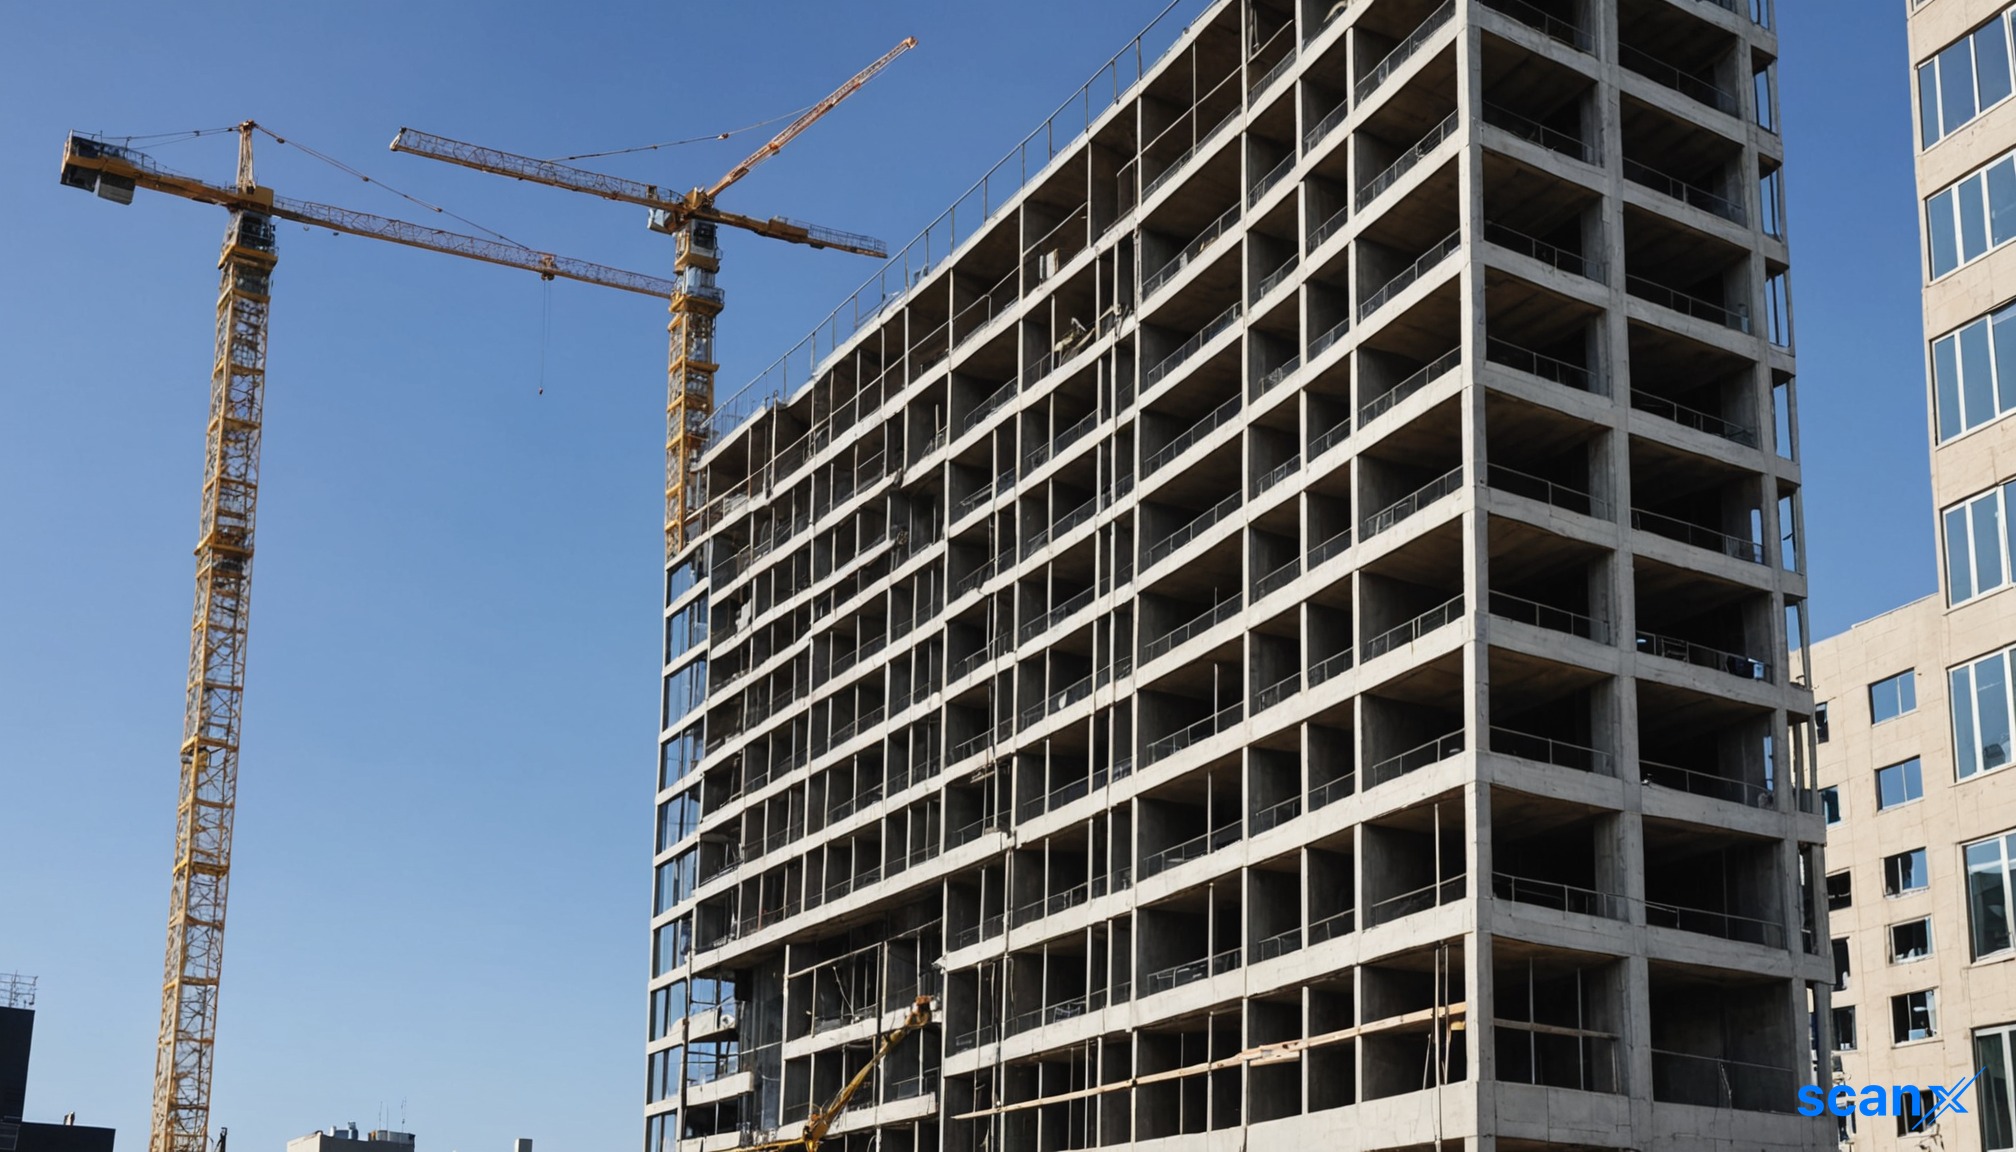
*this image is generated using AI for illustrative purposes only.
IRB Infrastructure Developers has submitted its Business Responsibility and Sustainability Report (BRSR) for the financial year ending March 31, 2026. The filing covers consolidated disclosures across its highway infrastructure operations and subsidiaries.
The report includes verified sustainability data assured by M/s. Carbon Check India Pvt. Ltd. under ISAE 3000 standards. It outlines performance against the nine principles of the National Guidelines on Responsible Business Conduct (NGRBC).
Environmental Performance
The company reported total energy consumption of 1,473,193.23 Giga Joules in FY26, up from 1,413,838.66 GJ in the prior year. Renewable sources contributed 12,038.08 GJ, representing approximately 1% of total consumption. Energy intensity per lane kilometer decreased to 82.06 GJ from 88.13 GJ in FY25.
Greenhouse gas emissions (Scope 1 and Scope 2) totaled 139,412.71 MT CO2e, rising from 128,092.26 MT CO2e in FY25. Emission intensity per lane kilometer fell to 7.77 MT CO2e from 7.98 MT CO2e.
| Metric | FY26 | FY25 | Unit |
|---|---|---|---|
| Total Energy Consumed | 1,473,193.23 | 1,413,838.66 | GJ |
| Scope 1 & 2 GHG Emissions | 139,412.71 | 128,092.26 | MT CO2e |
| Water Consumption | 2,341,885.80 | 1,424,815.35 | KL |
Water consumption increased significantly to 2,341,885.80 kilolitres from 1,424,815.35 KL. Water intensity per lane kilometer rose to 130.45 KL from 88.82 KL. Total waste generated dropped sharply to 281,757.36 metric tonnes from 745,297.76 MT, with a recovery rate of 99.07%.
Social Metrics
IRB employed 2,827 permanent employees and 3,446 workers at year-end. Female representation among permanent employees stood at 3.75%, while female workers accounted for 5.34% of the workforce. Gross wages paid to females constituted 6.09% of total wages, down from 6.57% in FY25.
Safety metrics improved with a Lost Time Injury Frequency Rate (LTIFR) of 0 for both employees and workers, compared to 0.022 and 0.043 respectively in FY25. No fatalities were recorded. Spending on employee well-being measures rose to 0.041% of revenue from 0.032%.
Governance and Operations
The company reported 413 shareholder complaints received during FY26, all resolved by year-end. Related-party transactions accounted for 36% of sales and 100% of loans and advances. Accounts payable days decreased to 25.57 days from 47.52 days.
What the Numbers Show
Waste generation intensity declined substantially despite operational expansion. Total waste generated fell by over 62% to 281,757.36 MT, while waste intensity per lane kilometer dropped from 46.46 MT to 15.69 MT. This divergence suggests improved material efficiency or changes in project mix, as the company added operational lane kilometers during the period.
Historical Stock Returns for IRB Infrastructure Developers
| 1 Day | 5 Days | 1 Month | 6 Months | 1 Year | 5 Years |
|---|---|---|---|---|---|
| -0.62% | +5.33% | -9.52% | -17.96% | -18.15% | +69.72% |

How does IRB's current 1% renewable energy usage compare to sector peers, and what specific investments are planned to increase this share in FY27?
What operational factors drove the 64% surge in water consumption, and what mitigation strategies will IRB implement to reduce water intensity per lane kilometer?
Given that related-party transactions account for 100% of loans and advances, how does IRB plan to diversify its financing sources to reduce dependency on internal group funding?
 15
15












 Access 50+ Readymade Screeners
  Use 200+ Custom Filters
  Get Full Market Insights





