

IOL Chemicals Q1 Results: Net profit rises 90% YoY to ₹64.5 crore


IOL Chemicals & Pharmaceuticals posted a 90.5% YoY rise in Q1FY27 PBT to ₹86.8 crore, fueled by 37.1% revenue growth to ₹756.3 crore. EBITDA margins expanded to 14.6%, driven by operating leverage as cost growth lagged revenue expansion. Exports contributed 71% of sales, underscoring the company's global market presence.


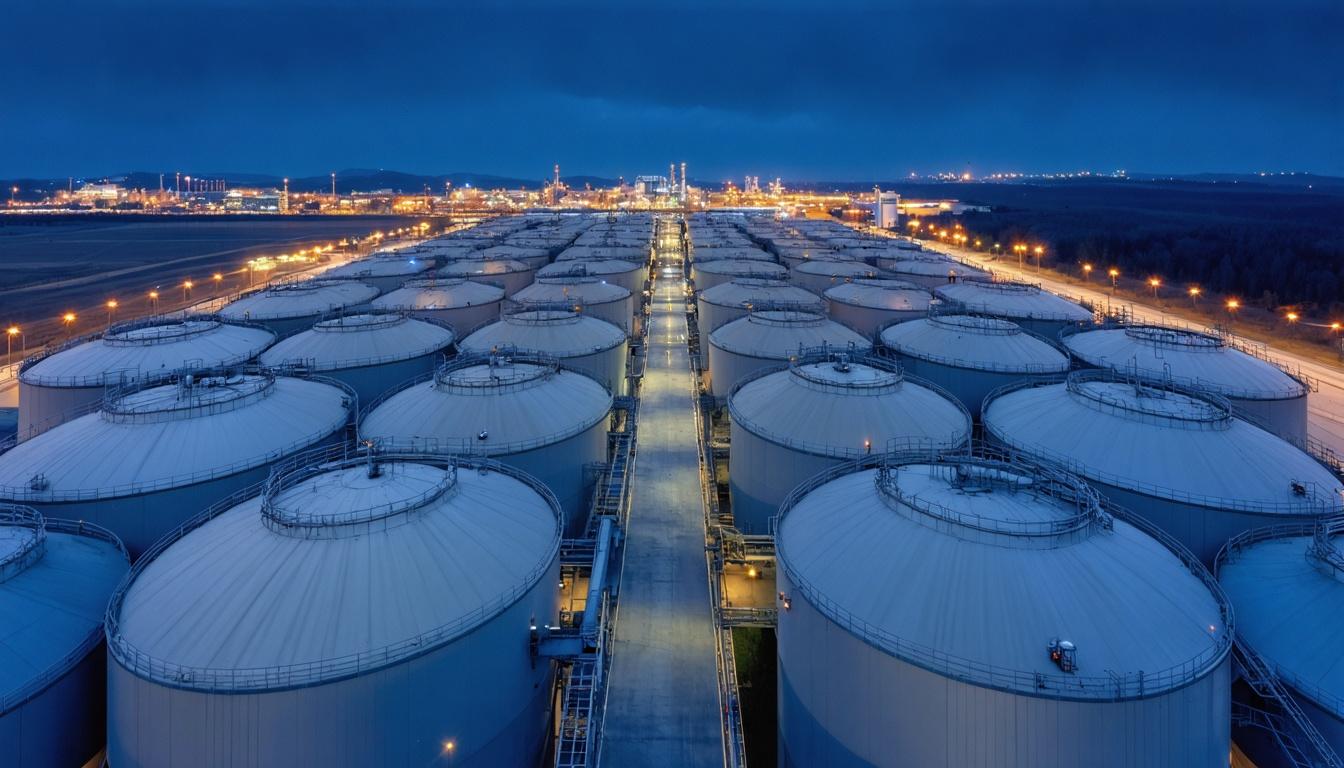
*this image is generated using AI for illustrative purposes only.
IOL Chemicals & Pharmaceuticals IOL Chemicals & Pharmaceuticals delivered strong financial performance in the first quarter of FY27, reporting significant growth across key profitability metrics. The company’s standalone profit before tax (PBT) surged 90.5% year-on-year to ₹86.8 crore, up from ₹45.5 crore in Q1FY26. Net profit after tax followed suit, rising 89.9% to ₹64.5 crore from ₹34.0 crore in the corresponding previous period.
Revenue from operations grew by 37.1% to ₹756.3 crore in Q1FY27, compared to ₹551.7 crore in Q1FY26. This top-line expansion was accompanied by improved operational efficiency, with EBITDA jumping 60.7% to ₹111.7 crore. Consequently, the EBITDA margin expanded by 220 basis points to 14.6% from 12.4% in the prior year quarter. Earnings before interest and taxes (EBIT) also rose sharply by 81.7% to ₹90.4 crore.
Segmental and Geographical Performance
The pharmaceutical segment continued to be the primary revenue driver, generating ₹469.5 crore in Q1FY27, up from ₹374.5 crore in Q1FY26. This represents a 25.4% year-on-year growth for the pharma business. The chemicals segment, net of intersegment transfers, contributed ₹286.8 crore, marking a substantial recovery from ₹244.9 crore in Q1FY26.
Geographically, the company remains heavily reliant on international markets. Exports accounted for 71% of total revenue, while domestic sales constituted the remaining 29%. This export-oriented structure highlights the company’s integration into global supply chains, particularly for active pharmaceutical ingredients (APIs) and specialty chemicals.
What the Numbers Show
A notable divergence exists between revenue growth and cost management in Q1FY27. While revenue grew 37.1%, employee benefits expense increased by only 23.4% (from ₹57.7 crore to ₹71.2 crore). Similarly, finance costs declined slightly to ₹3.6 crore from ₹4.2 crore in the prior year period. This suggests improved operating leverage, where fixed costs are being spread over a larger revenue base, directly contributing to the margin expansion observed in EBITDA and PAT percentages.
Balance Sheet and Cash Flow Position
As of March 2026, the company maintained a healthy balance sheet with total equity standing at ₹1,798.4 crore. Total borrowings under current liabilities were ₹132.0 crore, while non-current financial liabilities remained negligible at zero. Cash and cash equivalents at the end of FY26 stood at ₹65.3 crore, down from ₹78.0 crore at the end of FY25, reflecting ongoing capital investments and working capital requirements.
Operating cash flows remained robust, with net cash from operating activities totaling ₹214.4 crore in FY26, compared to ₹178.7 crore in FY25. This strong cash generation supports the company’s expansion plans, including the recently acquired 101-acre land parcel near Chandigarh-Bathinda Highway for future manufacturing capacity.
Strategic Outlook
The company continues to diversify beyond its core Ibuprofen business. The non-Ibuprofen share in the pharmaceuticals segment has grown from 18% to 37% over the past six years. Key products driving this diversification include Paracetamol, Metformin, Clopidogrel, Fenofibrate, and Pantoprazole. With 14 DMFs filed with the USFDA and 21 CEPs with EDQM, IOL Chemicals is positioned to expand its footprint in regulated markets.
The investor presentation, submitted in compliance with Regulation 30 of the SEBI (Listing Obligations and Disclosure Requirements) Regulations, 2015, was signed by Abhay Raj Singh, Sr. Vice President & Company Secretary, on August 12, 2026.
Historical Stock Returns for IOL Chemicals & Pharmaceuticals
| 1 Day | 5 Days | 1 Month | 6 Months | 1 Year | 5 Years |
|---|---|---|---|---|---|
| +1.12% | +1.35% | +7.41% | +187.74% | +103.73% | +76.31% |

How might the upcoming commissioning of the new 101-acre facility near Chandigarh-Bathinda impact IOL Chemicals' capacity utilization and margin trajectory in FY28?
Given the 71% reliance on exports, what are the potential risks to revenue stability from evolving global trade policies or currency fluctuations in key markets like the US and Europe?
Can the company sustain the current operating leverage and EBITDA margin expansion as raw material costs for APIs like Ibuprofen and Paracetamol fluctuate in the global market?
 20
20







 Create Custom Screeners
  Access 200+ Pre-built Filters
  Use 50+ Readymade Screener





