

IG Petrochemicals Q1FY27 EBITDA surges 1,173% to ₹1,188 Cr on margin recovery


IG Petrochemicals delivered a significant operational turnaround in Q1FY27, reporting consolidated EBITDA of ₹1,187.92 crore and net profit of ₹664.41 crore, reversing previous losses. The performance was driven by improved margins in Phthalic Anhydride and Maleic Anhydride. The company is advancing downstream integration with new plasticizer and CBG plants expected to start production in FY27.


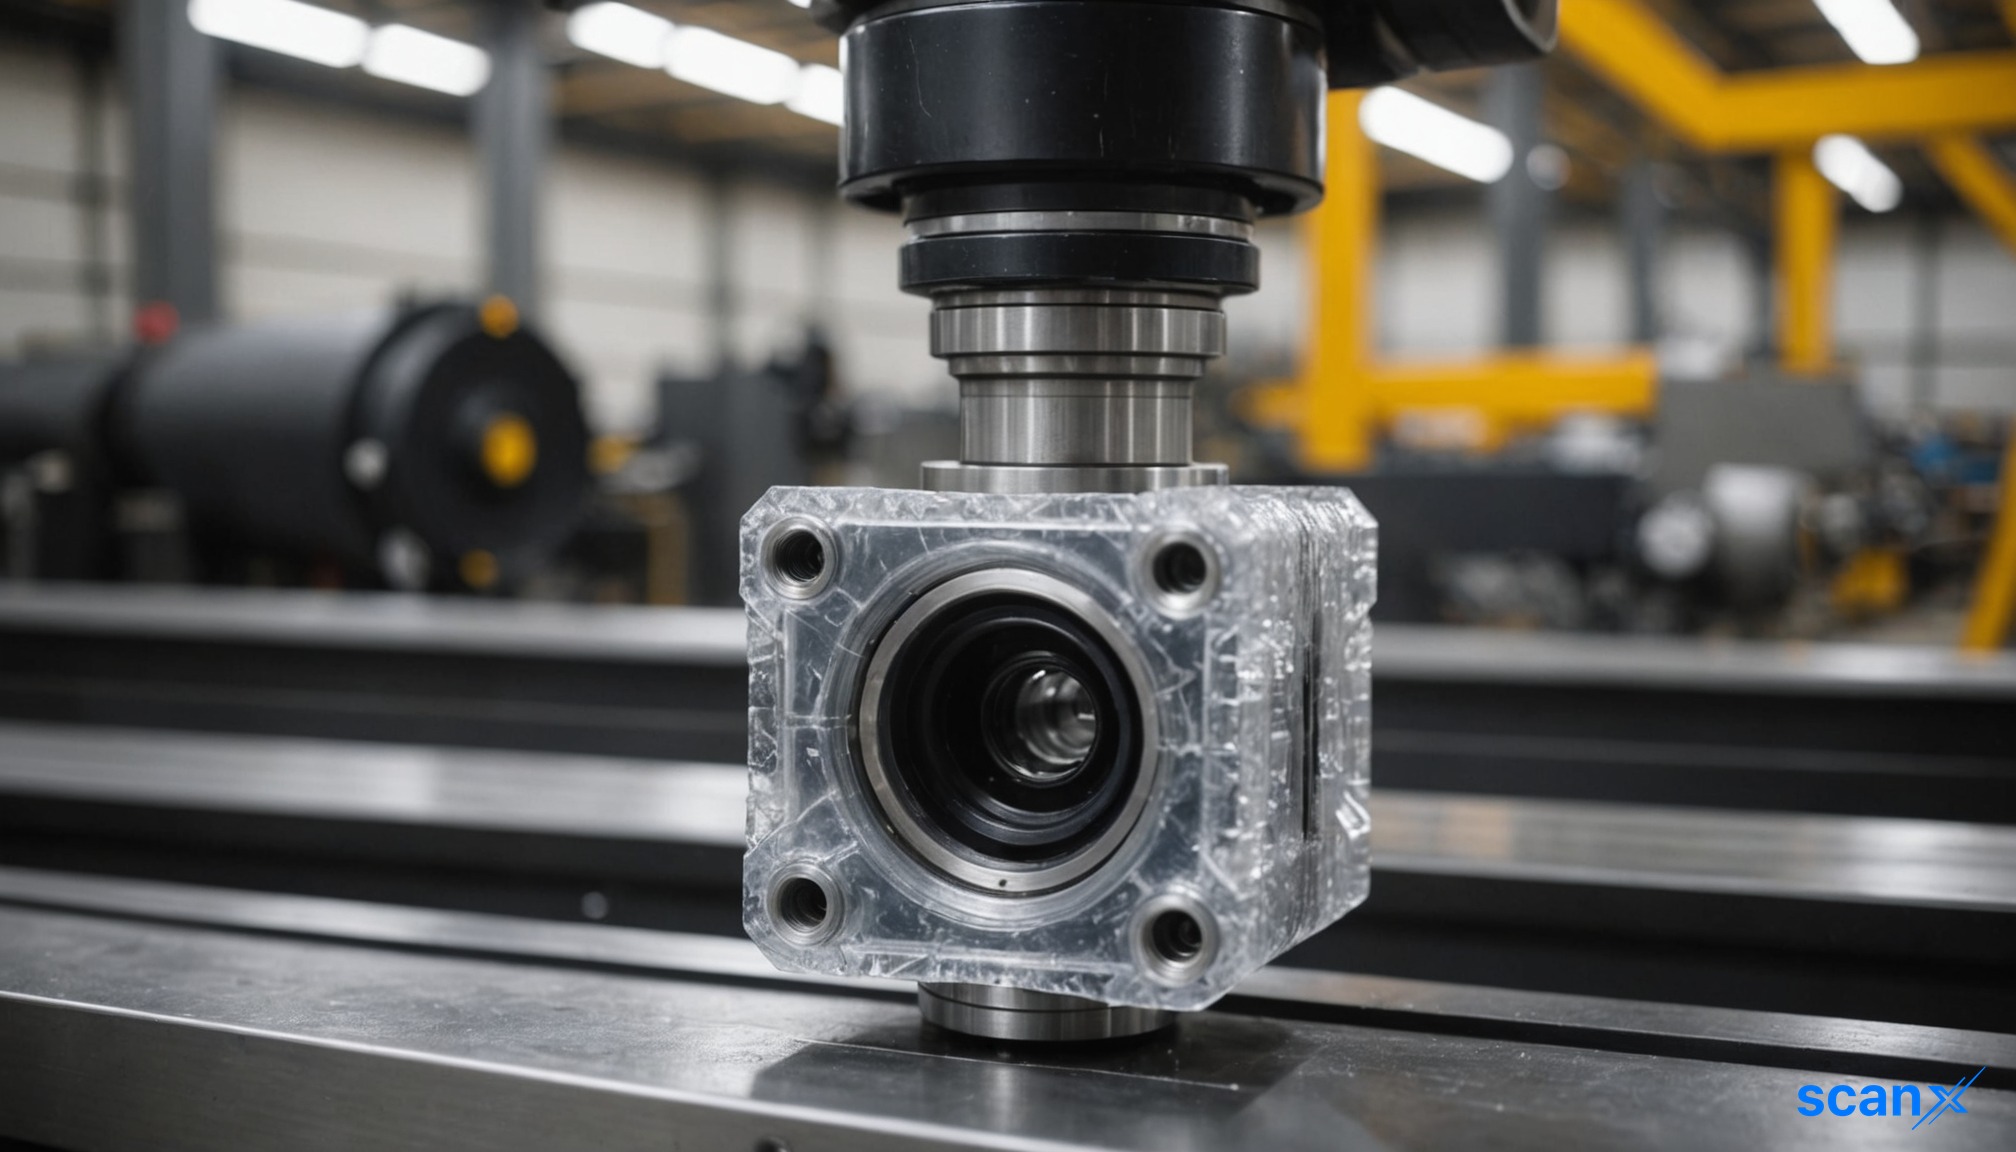
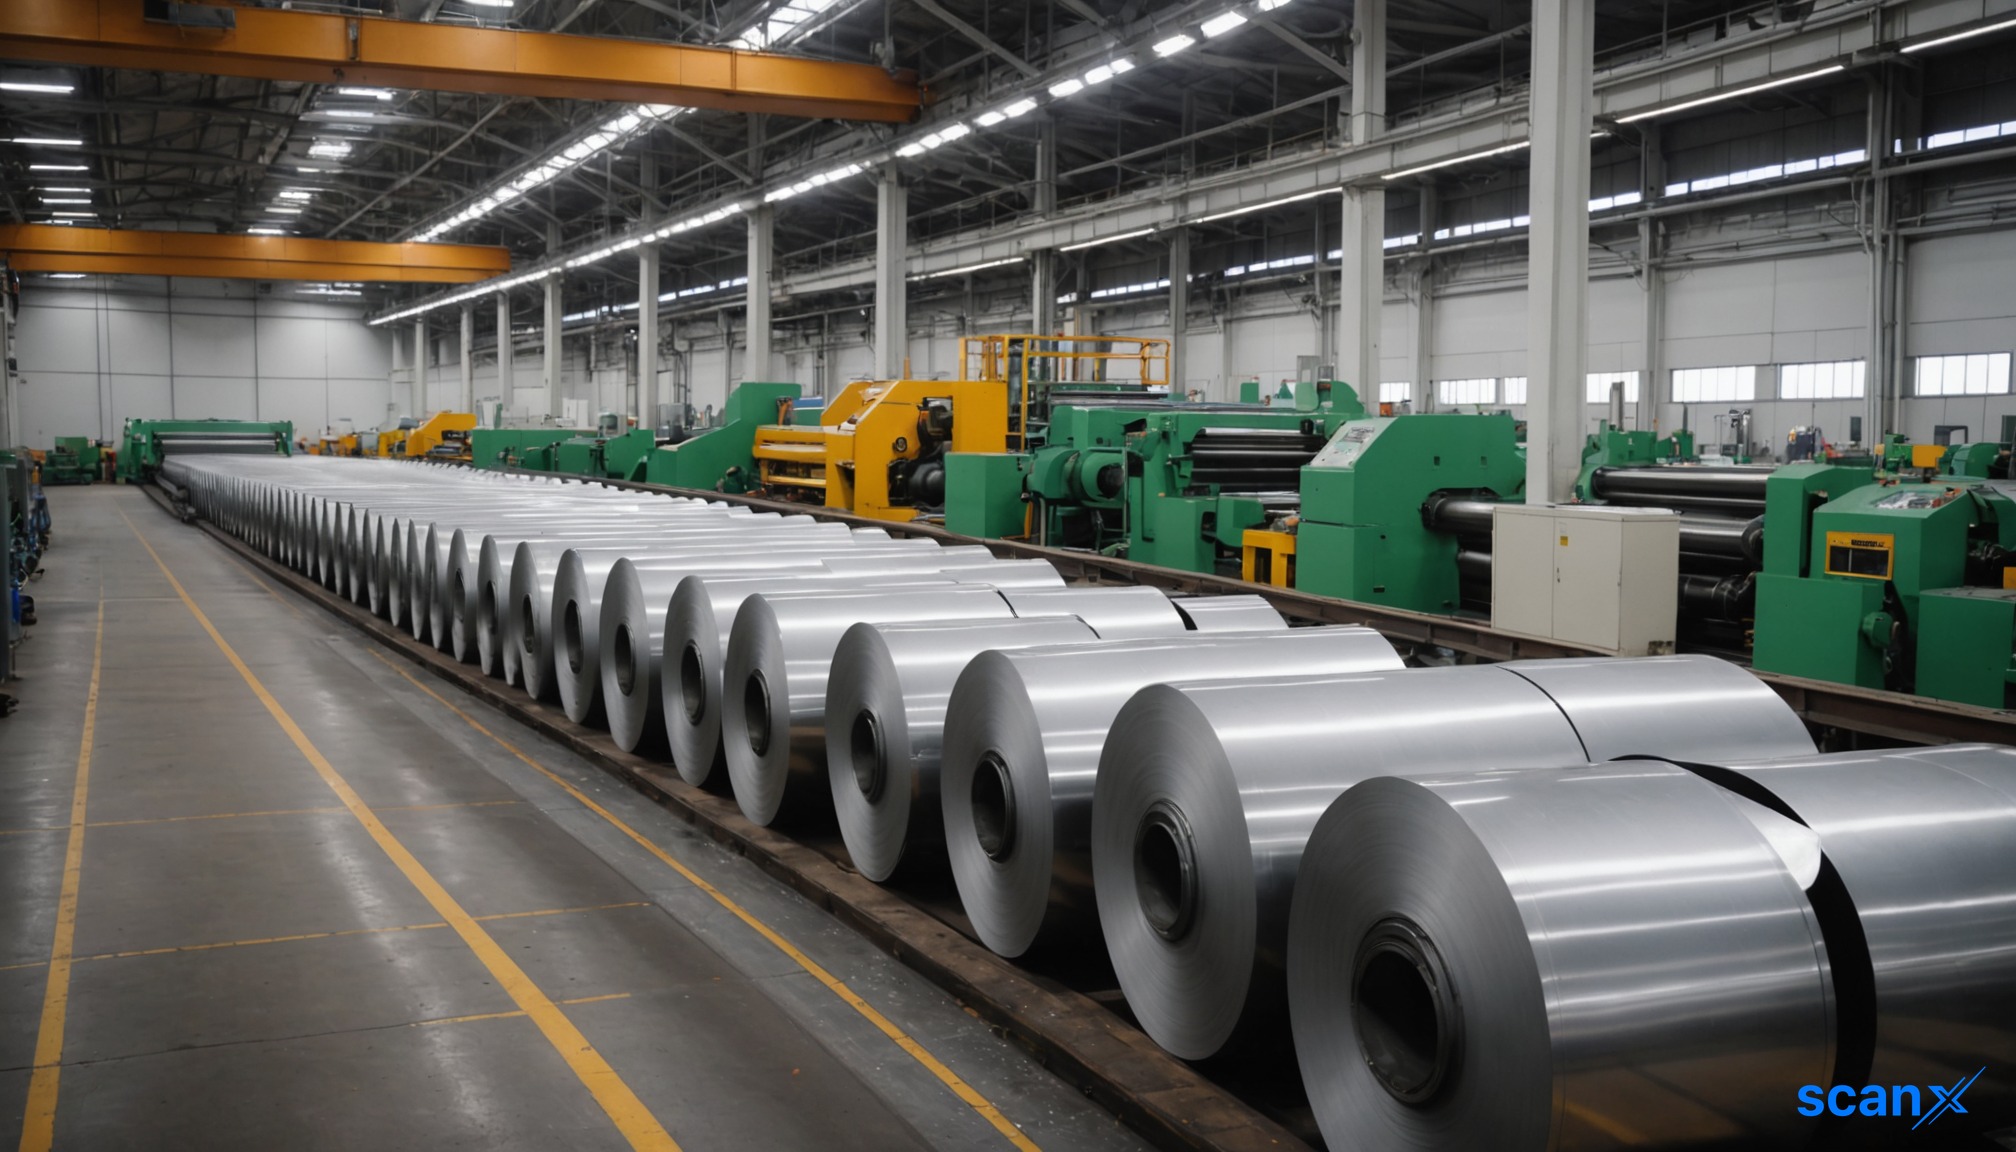
*this image is generated using AI for illustrative purposes only.
I G Petrochemicals Limited delivered a significant operational turnaround in the first quarter of FY27, reporting consolidated EBITDA of ₹1,187.92 crore compared to ₹93.29 crore in Q1FY26. The company returned to profitability with a consolidated net profit after tax of ₹664.41 crore, reversing a loss of ₹129.87 crore in the corresponding period last year. This performance reflects strong demand for its organic chemicals, particularly Phthalic Anhydride (PAN), and improved operational efficiencies across its integrated Taloja complex.
The Board of Directors approved the unaudited financial results on August 5, 2026, pursuant to Regulation 33 of the SEBI (Listing Obligations and Disclosure Requirements) Regulations, 2015. The results were prepared in accordance with Indian Accounting Standard 34 (Ind AS 34). Statutory auditors M S K A & Associates LLP and SMMP & Company issued an unqualified limited review report. The company’s total income for the quarter reached ₹6,244.11 crore, up from ₹4,800.65 crore in Q1FY26.
Financial Performance Overview
The quarter’s results highlight a broad-based improvement across key metrics. Standalone total income was ₹6,250.71 crore, with standalone profit before tax at ₹949.18 crore and net profit after tax at ₹709.70 crore. In contrast, the standalone entity reported a net loss of ₹82.14 crore in Q1FY26. Consolidated earnings per share (basic and diluted) rose to ₹21.57 from a loss of ₹4.22 per share in the prior year.
| Metric | Q1FY27 (₹ Cr) | Q1FY26 (₹ Cr) | YoY Change |
|---|---|---|---|
| Total Income | 6,244.11 | 4,800.65 | +30.07% |
| EBITDA | 1,187.92 | 93.29 | +1,173.36% |
| Net Profit After Tax | 664.41 | (129.87) | Turnaround |
| EPS (Basic & Diluted) | ₹21.57 | (₹4.22) | Positive |
Product Mix and Operational Drivers
Revenue from the Non-Phthalic business stood at ₹49 crore, led by an improvement in overall realizations in Di-ethyl Phthalate (DEP) and Maleic Anhydride (MAN). Exports contributed approximately 10% of total revenue during Q1FY27, reflecting continued progress in expanding international presence. IGPL remains India's largest single-site PAN manufacturer with ~50% domestic market share and the sole domestic producer of MAN.
Forward-Looking Capacity Expansion
The company is advancing its downstream integration strategy to diversify revenue mix. The plasticizer plant at the Taloja complex is expected to start production in Q2FY27, following mechanical completion in March 2026. Additionally, the Compressed Biogas (CBG) project, which converts organic waste to biogas, is targeted for mechanical completion in Q2FY27 and production start in Q3FY27. These initiatives aim to reduce single-product dependence and expand the earnings base over the coming years.
Subsidiary and Auditor Notes
The consolidated results include four subsidiaries: IGPL International Limited, IGPL Energy Limited, IG Biofuels Limited, and IGPL Charitable Foundation. The auditor’s report noted that the interim financial information of these subsidiaries, which reflect a total revenue of ₹21.12 lakh and a net loss of ₹477.11 lakh for the quarter, was not reviewed by their respective auditors but certified by the holding company’s management. Management stated that these figures are not material to the Group. M S K A & Associates LLP and SMMP & Company confirmed that nothing came to their attention to suggest the statements do not comply with Ind AS 34 or contain material misstatements.
Historical Stock Returns for IG Petrochemicals
| 1 Day | 5 Days | 1 Month | 6 Months | 1 Year | 5 Years |
|---|---|---|---|---|---|
| -0.55% | +0.33% | +3.32% | +61.52% | +37.28% | -35.60% |

How will the upcoming commissioning of the plasticizer plant in Q2FY27 impact IGPL's revenue mix and reduce its dependence on Phthalic Anhydride?
What are the projected margins and operational challenges for the Compressed Biogas (CBG) project once it begins production in Q3FY27?
Given the 10% export contribution, which international markets is IGPL prioritizing to sustain growth amid potential global trade barriers?
 15
15





 Access 50+ Readymade Screeners
  Use 200+ Custom Filters
  Get Full Market Insights





