

HP Cotton Textile Mills Q1 Results: Net Profit Jumps 96.77% YoY


H.P. Cotton Textile Mills Ltd reported Q1FY27 results with consolidated net profit up 96.77% to ₹4,026.83 crore and revenue up 47.27% to ₹12,886.27 crore. Standalone PAT surged 253% to ₹2,870.21 crore, reflecting strong operational efficiency.


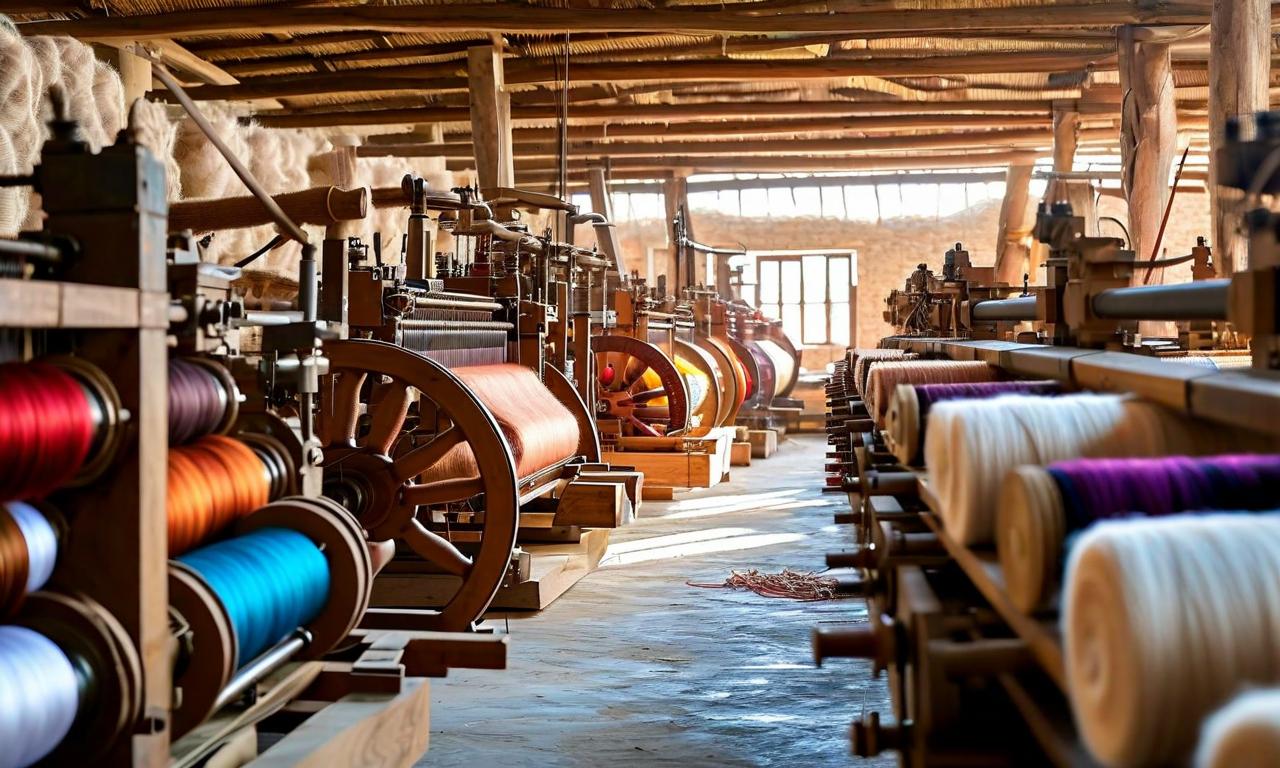
*this image is generated using AI for illustrative purposes only.
H.P. Cotton Textile Mills H.P. Cotton Textile Mills reported a significant acceleration in profitability for the quarter ended June 30, 2026, with consolidated net profit surging 96.77% year-on-year to ₹4,026.83 crore. The strong bottom-line performance was underpinned by robust top-line growth, as consolidated revenue from operations expanded by 47.27% to ₹12,886.27 crore. This result signals a substantial improvement in operational leverage and market demand for the company’s textile products during the first quarter of FY27.
The Board of Directors approved the unaudited standalone and consolidated financial results at a meeting held on August 07, 2026. The disclosure was made pursuant to Regulation 47 of the SEBI (Listing Obligations and Disclosure Requirements) Regulations, 2015. The results were subsequently published in newspapers and on the company’s website for investor access.
Financial Performance Overview
The company demonstrated strong growth across both standalone and consolidated metrics. Standalone revenue from operations grew by 58.77% to ₹7,958.14 crore, outpacing the consolidated revenue growth rate. This divergence suggests that subsidiary operations may have experienced different margin dynamics or scale effects compared to the parent entity.
| Metric | Consolidated (₹ Cr) | Standalone (₹ Cr) | YoY Change |
|---|---|---|---|
| Revenue from Operations | 12,886.27 | 7,958.14 | Rev: +47.27% / +58.77% |
| EBITDA | 6,322 | 4,605 | Not Disclosed |
| Net Profit (PAT) | 4,026.83 | 2,870.21 | PAT: +96.77% / +253% |
| EPS | ₹22.32 | ₹17.65 | EPS: +91.42% / +253% |
Consolidated earnings per share (EPS) increased by 91.42% to ₹22.32 per share, while standalone EPS jumped 253% to ₹17.65 per share. The disproportionate rise in standalone PAT compared to revenue indicates improved cost efficiencies or favorable one-off items within the parent company’s operations.
What the Numbers Show
A key analytical observation is the widening gap between standalone and consolidated profit growth. While standalone revenue grew by 58.77%, standalone net profit skyrocketed by 253%. In contrast, consolidated revenue grew by 47.27% with consolidated net profit rising by 96.77%. This suggests that the parent company benefited from significantly higher operating margins or lower tax rates than its subsidiaries in this quarter. Investors should monitor whether this margin expansion is sustainable or driven by temporary factors such as inventory write-downs or exceptional gains.
The consolidated EBITDA stood at ₹6,322 crore, yielding an implied EBITDA margin of approximately 49.1%, which is exceptionally high for the textile sector. This high margin profile reinforces the strength of the company’s pricing power or product mix during Q1FY27. The detailed financial statements are available on the company’s website for further scrutiny by analysts and shareholders.
Historical Stock Returns for HP Cotton Textile Mills
| 1 Day | 5 Days | 1 Month | 6 Months | 1 Year | 5 Years |
|---|---|---|---|---|---|
| -1.22% | -6.80% | -8.89% | -24.17% | -19.21% | -13.91% |

Can the company sustain its exceptional 49.1% consolidated EBITDA margin in Q2FY27, or is this driven by temporary seasonal pricing power?
What specific operational efficiencies or one-off gains contributed to the disproportionate 253% surge in standalone net profit compared to revenue growth?
How will the widening divergence between standalone and subsidiary performance impact future capital allocation and dividend policies?
 17
17













 Access Market Heat-map & Insights
  Create, Save & Share your Screener
  Use 200+ Screening Filters





