Go Fashion FY26 results: Net profit falls 37%, buyback concludes

2 min read     Updated on 17 Aug 2026, 07:18 PM
scanx
Reviewed by
Ashish TScanX News Team
AI Summary

Go Fashion (India) Limited reported a 36.71% drop in net profit to ₹591.8 million for FY25-26, despite maintaining a robust 63.2% gross margin. Revenue declined marginally by 1.2% to ₹8,380.1 million as the company rationalized its store network, closing small outlets to focus on larger formats. A ₹649.9 million share buyback was completed, and non-leggings products now drive 71% of revenue.

powered bylight_fuzz_icon
48520123

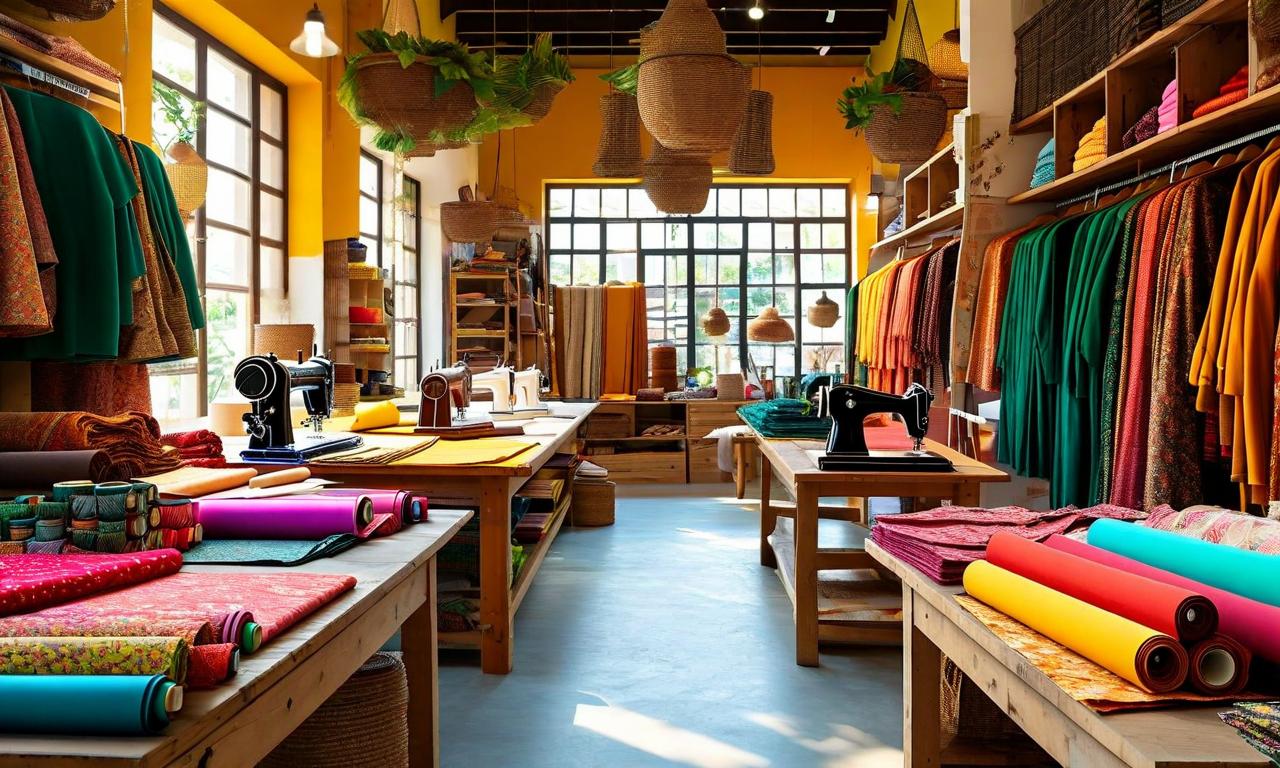
*this image is generated using AI for illustrative purposes only.

Go Fashion (India) Limited Go Fashion (India) Limited has scheduled its 16th Annual General Meeting (AGM) for September 8, 2026, to adopt the audited financial statements for the fiscal year ended March 31, 2026. The meeting will be held via Video Conferencing or Other Audio-Visual Means (OAVM), with the book closure period running from September 2 to September 8, 2026.

The primary agenda includes the re-appointment of Mr. Vinod Kumar Saraogi as a director liable to retire by rotation. Shareholders will also review the company's strategic pivot during FY25-26, which involved closing smaller stores and expanding into larger formats to enhance product discovery.

Financial Performance

For FY25-26, the company reported revenue from operations of ₹8,380.1 million, a marginal decline of 1.20% from ₹8,481.7 million in the previous year. Profit after tax fell sharply by 36.71% to ₹591.8 million, compared to ₹935.0 million in FY24-25. EBITDA decreased by 11.51% to ₹2,371.1 million.

The decline in profitability was attributed to lower operating leverage resulting from moderated sales volumes, alongside continued investments in retail expansion, technology, and supply chain capabilities. Despite the earnings moderation, the company maintained a gross margin of 63.2%, reflecting disciplined pricing strategies.

Metric FY25-26 FY24-25 Change
Revenue from Operations ₹8,380.1 million ₹8,481.7 million -1.20%
EBITDA ₹2,371.1 million ₹2,679.6 million -11.51%
Profit After Tax ₹591.8 million ₹935.0 million -36.71%
Gross Margin 63.2% 61.7% +150 bps

Strategic Shifts and Capital Allocation

A significant development during the year was the completion of a share buyback. The company bought back 1.41 million equity shares at ₹460 per share, with a total payout of ₹649.9 million. The shares were extinguished in March 2026, reducing the paid-up equity capital.

Operationally, Go Fashion executed a deliberate reset of its retail network. The company closed multiple small-format stores under 400 sq ft, citing limited product visibility as a constraint on customer discovery. Instead, it added approximately 43,000 sq ft of net retail space, focusing on larger formats of 700 sq ft and above. This shift aims to display the full breadth of its portfolio, which now includes trousers, palazzos, and athleisure, rather than just legacy leggings.

What the Numbers Show

The composition of revenue reveals a successful diversification away from core leggings. Approximately 71% of FY25-26 revenue came from value-added, non-leggings bottomwear categories. This structural shift indicates that the brand has evolved into a broader bottomwear destination, reducing dependency on a single product type while maintaining pricing discipline through full-price sales, which constituted 95% of Exclusive Brand Outlet sales.

Outlook and Governance

The Board did not recommend any dividend for FY25-26. Looking ahead, the company plans to continue its "small-format-light, larger-format-led" strategy, with early signs of recovery noted in Q4 FY25-26 when close to 275 stores delivered positive same-store sales growth averaging 11%. The company also initiated a pilot for everyday casual wear for men and women and opened its first international store in the Middle East.

Historical Stock Returns for Go Colors

1 Day5 Days1 Month6 Months1 Year5 Years
+5.05%+6.83%+0.34%+1.49%-49.92%-72.56%

How will the transition to larger store formats impact Go Fashion's average revenue per square foot and overall operating leverage in FY26-27?

What is the projected timeline for profitability recovery given the continued capital expenditure on technology and supply chain capabilities?

How might the pilot launch of everyday casual wear for men and women influence the company's long-term product mix and customer acquisition costs?

Go Fashion (India) Ltd sees SSSG turn positive in Q1 FY27 as revenue holds steady

2 min read     Updated on 05 Aug 2026, 06:42 PM
scanx
Reviewed by
Naman SScanX News Team
AI Summary

Go Fashion (India) Limited delivered a mixed but strategically positive Q1 FY27 performance. While revenue remained flat at ₹223 crore and EBITDA declined slightly due to marketing spends, the company achieved its first positive same-store sales growth in several quarters. The shift toward larger store formats is driving better unit economics, with stores above 700 sq ft showing 2.5–3% SSSG. The LFS channel recovered to ₹50 crore, and the new daily wear concept shows early profitability.

powered bylight_fuzz_icon
46977282

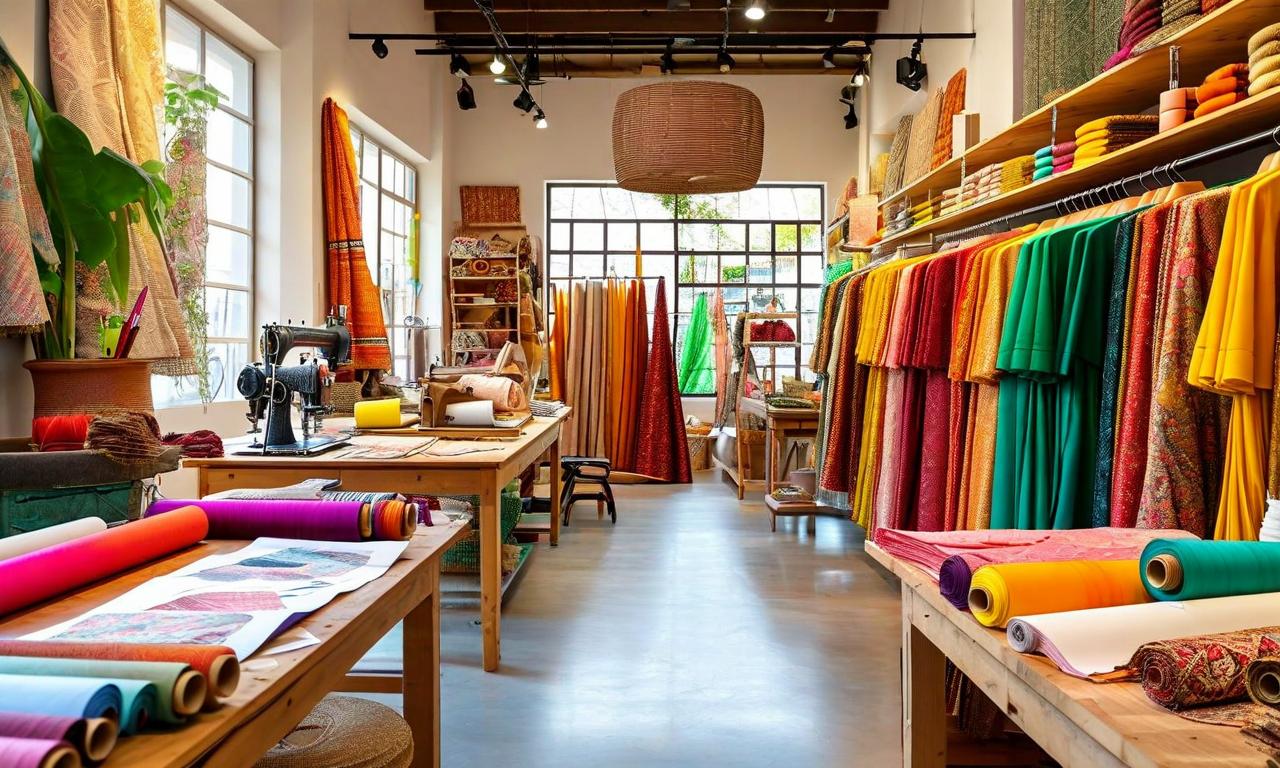
*this image is generated using AI for illustrative purposes only.

Go Fashion (India) Limited reported a turnaround in same-store sales growth (SSSG) for the first quarter of FY27, marking the first positive reading in several quarters. The company’s revenue from operations remained flat year-on-year at ₹223 crore, while net profit stood at ₹16 crore. This development signals early progress in the company’s strategic shift toward larger store formats and brand rejuvenation, although management cautioned that a single quarter does not yet establish a long-term trend.

The earnings call transcript, released on August 05, 2026, details the financial results for the quarter ended June 30, 2026. Go Fashion (India) Limited disclosed these figures pursuant to Regulation 30 of the SEBI (Listing Obligations and Disclosure Requirements) Regulations, 2015. The call was moderated by SGA, the company’s investor relations advisors, with commentary provided by CEO Gautam Saraogi and CFO R. Mohan.

Financial Performance

Revenue from operations remained stable compared to the corresponding period last year. Gross profit was reported at ₹140 crore, reflecting a gross profit margin of 62.9%. EBITDA before exceptional items stood at ₹67.4 crore, representing a 2% decline year-on-year. This moderation was primarily attributed to incremental marketing investments, including the onboarding of Shraddha Kapoor as brand ambassador, which pushed advertising spend to 2.3% of revenue. Management expects advertising spend to remain between 2% and 3% of revenue for FY27.

An exceptional expense of ₹6.5 crore was recorded due to the write-off of capital expenditure related to store closures, part of the network consolidation strategy. Return on capital employed (ROCE) excluding Ind AS impact was 10.8%, while return on equity (ROE) was 7.9%. Cash and cash equivalents stood at ₹202 crore as of June 30, 2026.

Metric Q1 FY27 Value YoY Change / Note
Revenue ₹223 crore Flat
Gross Profit ₹140 crore Margin: 62.9%
EBITDA (Pre-exceptional) ₹67.4 crore Down 2%
Net Profit (PAT) ₹16 crore -
Cash & Equivalents ₹202 crore As of June 30, 2026

Operational Highlights

Same-store sales growth for the exclusive brand outlet (EBO) channel turned positive at 0.6%, with same-cluster sales growth at 1.2%. Larger stores (above 700 square feet) performed significantly better, reporting SSSG in the range of 2.5% to 3%. The company closed 66 smaller stores during the quarter to make way for larger formats, resulting in a net reduction of 7,000 square feet in total retail space. However, management projects an 8% to 10% increase in deployed square feet on a year-through basis by end-FY27.

The limited format store (LFS) channel showed signs of recovery, growing 2% year-on-year to ₹50 crore after supply chain disruptions normalized. The new daily wear concept, currently operating in 15 stores, is performing well with 12 to 13 stores already profitable. These stores generate approximately ₹1,000 per square foot per month. Management aims to scale this concept to 25–30 stores by end-FY27.

What the Numbers Show

The divergence between blended SSSG (0.6%) and large-format SSSG (2.5–3%) underscores the effectiveness of Go Fashion’s store migration strategy. While overall sales growth remains modest, the stronger performance of larger outlets validates the decision to consolidate the network. Additionally, the stabilization of the LFS channel and profitability in new daily wear concepts suggest that recent strategic investments are beginning to yield operational efficiencies, even as raw material inflation pressures gross margins in subsequent quarters.

Historical Stock Returns for Go Colors

1 Day5 Days1 Month6 Months1 Year5 Years
+5.05%+6.83%+0.34%+1.49%-49.92%-72.56%

How will the sustained 2-3% advertising spend impact Go Fashion's EBITDA margins in the medium term, given the current 2% YoY decline?

What specific operational challenges might arise from scaling the daily wear concept to 25-30 stores while managing raw material inflation pressures?

Will the projected 8-10% increase in deployed square feet by end-FY27 dilute the higher per-square-foot returns currently seen in larger formats?

More News on Go Colors

1 Year Returns:-49.92%