Equinor Q1FY26 Results: Record production lifts operating income to $9.8 billion

scanx
Reviewed by
Jubin VScanX News Team
Key Highlights
  • Record production of >2.3 million bpd, up 9% YoY, driven by NCS regularity and US output
  • Adjusted operating income reached $9.8 billion; net income was $3.1 billion
  • MMP segment delivered $787 million pre-tax, double guidance, amid market volatility
  • Underlying OPEX fell 6% as unit costs declined from $6.36 to projected $6 per barrel
  • Dividend set at $0.39 per share with $375 million buyback tranche; net debt ratio at 15%
powered bylight_fuzz_icon
51176180

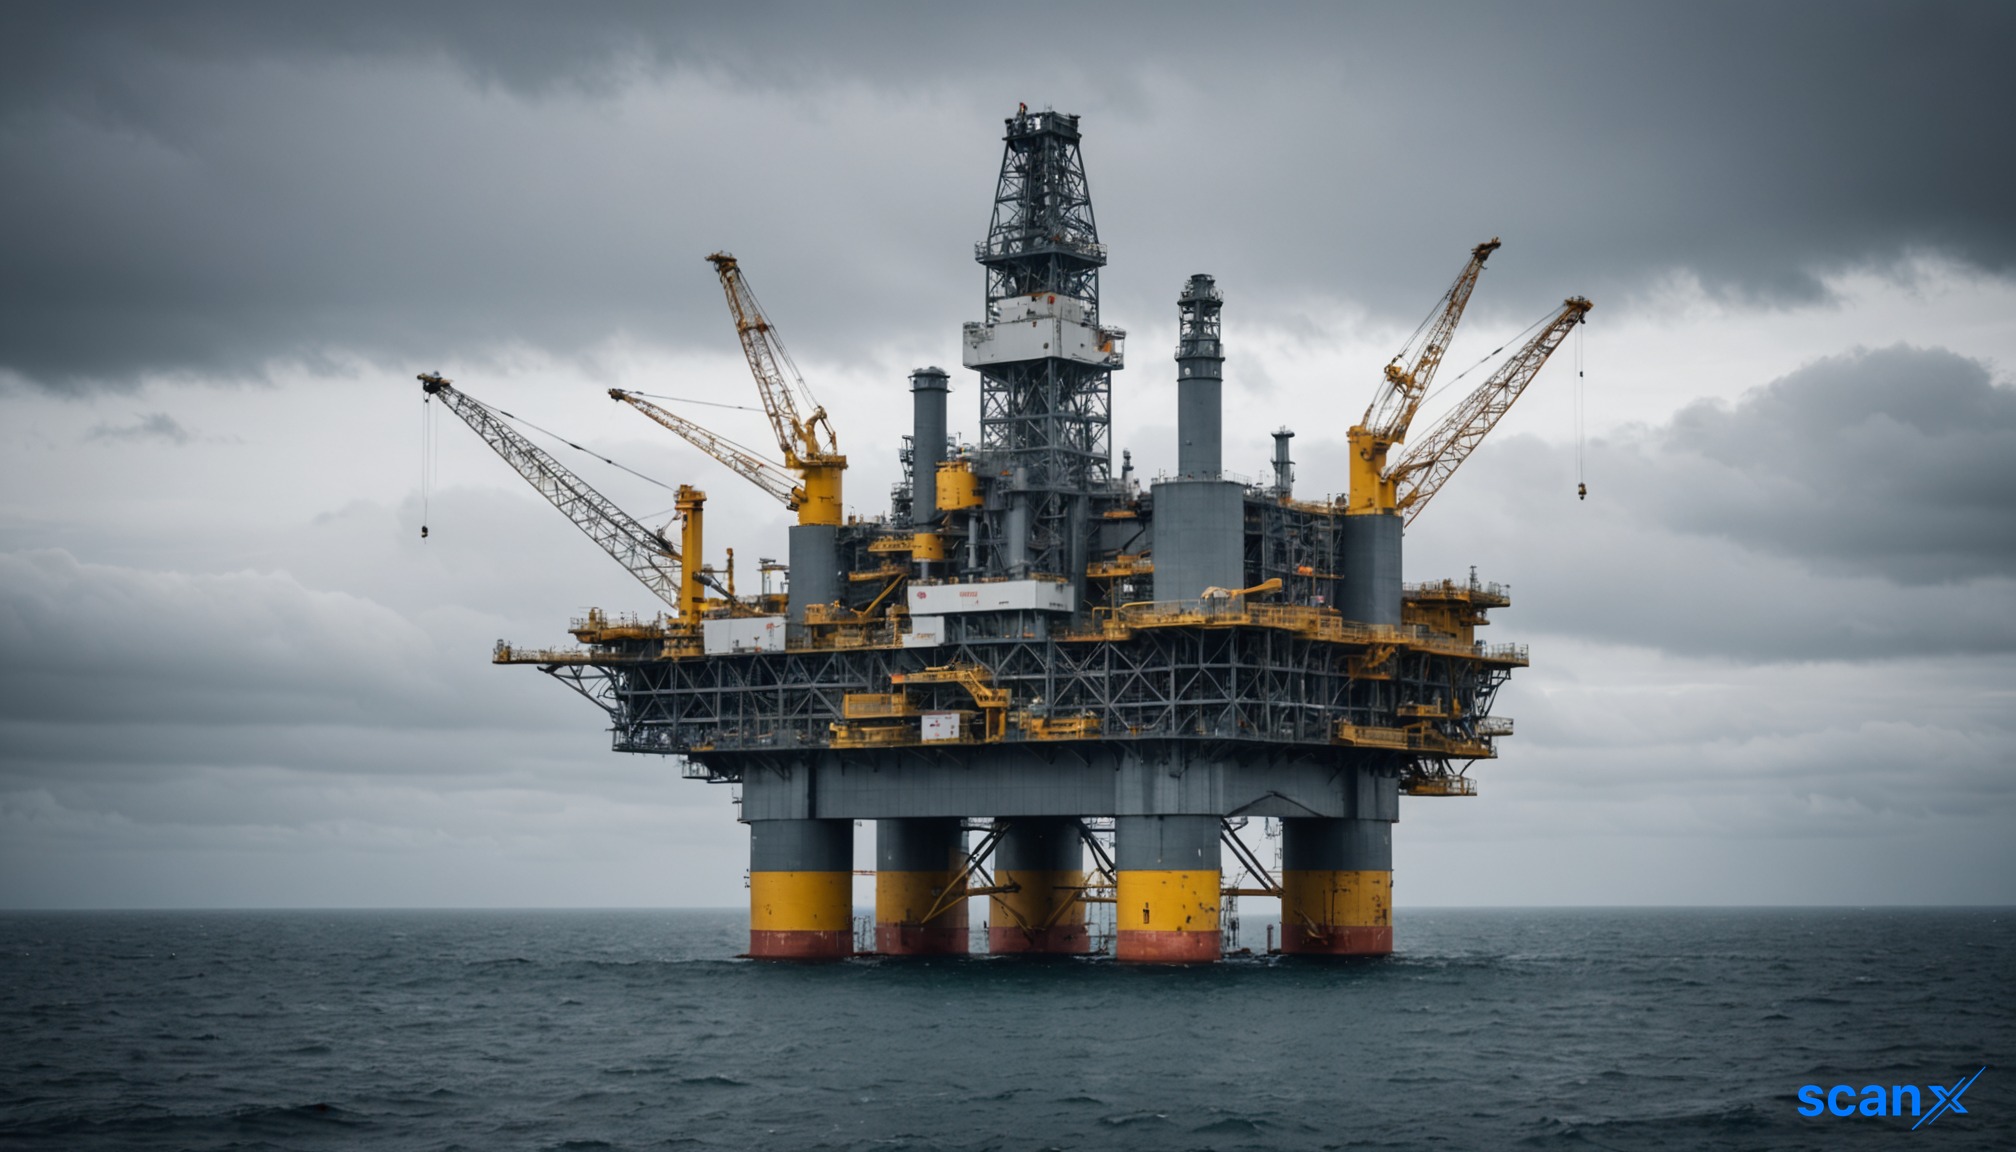
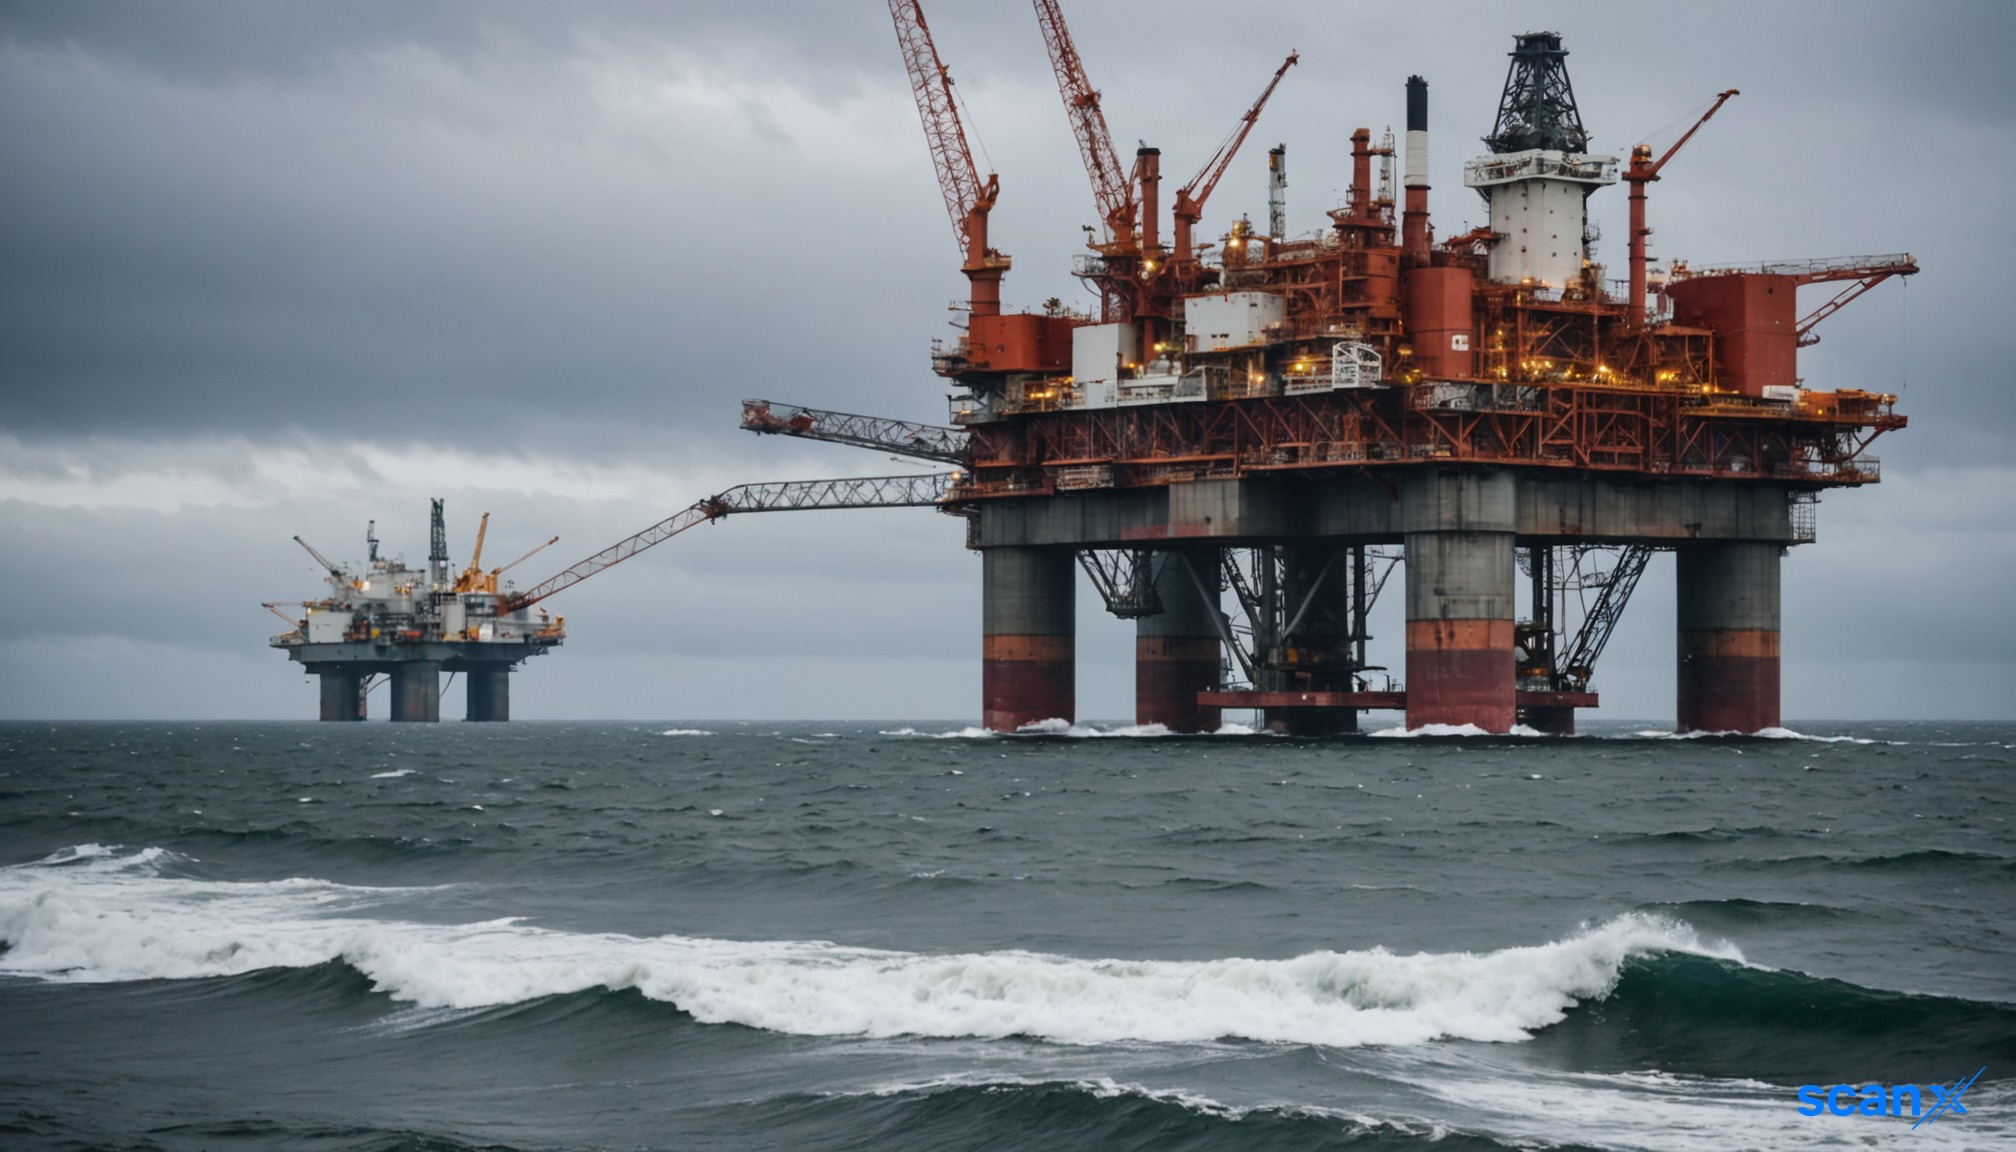
*this image is generated using AI for illustrative purposes only.

Equinor ASA delivered record-high production in the first quarter of 2026, rising 9% year-on-year to more than 2.3 million barrels per day. This operational milestone drove adjusted operating income to $9.8 billion and net income to $3.1 billion. Cash flow from operations after tax stood at $6 billion, impacted by increased trading collaterals.

Operational Performance

The production increase was driven by high regularity on the Norwegian Continental Shelf (NCS) and record output in the US. NCS production rose 10%, supported by the ramp-up of Johan Castberg, Halten East, and Verdande fields. In the US, record production was fueled by the Caesar Tonga offshore project and strong onshore gas positions. International production also increased, partly offset by reduced ownership stakes in certain assets.

Metric Q1 2026 Change Driver
Total Production >2.3 million bpd +9% YoY NCS regularity, US records
Adjusted Operating Income $9.8 billion High prices, volume growth
Net Income $3.1 billion Strong financial items
EPS (Adjusted) $1.48 Financial item impact

Financial Highlights

E&P Norway contributed $7.7 billion in pre-tax adjusted operating income, benefiting from strong price realizations. Crude from Johan Sverdrup traded at a premium of up to $13 per barrel against Brent, compared to a historical discount. Marketing and Trading (MMP) delivered $787 million before tax, double the quarterly guidance, capturing value from market volatility. The New Power segment, combining renewables and power trading, reported results close to zero.

Underlying operating expenses (OPEX) and SG&A fell 6% despite production growth. When adjusted for currency effects, costs decreased by more than 10%. Management highlighted that unit production costs are expected to decline from $6.36 to $6 per barrel during the year.

Balance Sheet and Capital Allocation

Equinor maintains a net debt ratio of 15% and a cash position of $20 billion. The company approved a cash dividend of $0.39 per share and a second tranche of share buybacks totaling up to $375 million. The full-year buyback guidance remains at $1.5 billion. Organic capital expenditure for the quarter was $3 billion, in line with annual guidance.

Cash flow was affected by an $800 million net increase in working capital and nearly $900 million in cash collaterals posted due to market volatility. Conversely, the company received an $800 million positive price review settlement, which is excluded from operating cash flow. Tax payments on the NCS totaled $4.2 billion in the quarter.

What the Numbers Show

The divergence between reported cost growth (up 9%) and underlying cost reduction (down 6%) highlights the impact of scale and external factors. While absolute costs rose due to higher production volumes and shipping rates, the company successfully reduced unit costs. This efficiency gain, combined with premium crude differentials, allowed Equinor to expand margins significantly despite the inflationary pressure on transportation and energy inputs.

How might Equinor's strategy of maintaining a low net debt ratio of 15% influence its ability to pursue large-scale M&A opportunities in the energy transition sector?

What are the long-term implications for Equinor's profitability if the premium on Johan Sverdrup crude reverts to historical discount levels against Brent?

Given the New Power segment's near-zero results, what specific operational or market hurdles must be overcome for renewables to become a significant contributor to adjusted operating income?

like20
dislike

Equinor Q2FY26 Results: Adjusted operating income up to $11 billion

scanx
Reviewed by
Riya DScanX News Team
Key Highlights
  • Adjusted operating income reached $11 billion pre-tax in Q2 2026
  • Production grew 3% YoY to 2,165,000 barrels per day
  • Net debt ratio fell to 10.4% with $24 billion in cash reserves
  • Share buyback program doubled to $3 billion for 2026
  • MMP segment delivered $777 million pre-tax, beating $400 million guidance
powered bylight_fuzz_icon
51176167

*this image is generated using AI for illustrative purposes only.

Equinor (NYSE: EQNR) delivered robust financial performance in the second quarter of 2026, driven by higher energy prices and increased production volumes. The company reported an adjusted operating income of $11 billion before tax, while year-to-date IFRS net income reached $4.8 billion.

Production grew 3% year-on-year to 2,165,000 barrels per day, supported by new fields on the Norwegian continental shelf (NCS) and international assets. Despite operational challenges at the Johan Castberg field, management maintained its full-year production growth guidance of 3%.

Financial Performance

Equinor’s cash flow from operations after tax stood at $13.7 billion for the quarter. Adjusted earnings per share were $1.33. The strong results were bolstered by higher liquids and European gas prices compared to the same period last year, although US gas prices declined.

Metric Q2 2026 Context
Adjusted Operating Income (Pre-tax) $11 billion Strong contribution from E&P Norway and International
Cash Flow from Operations (After-tax) $13.7 billion Robust liquidity generation
Net Income (YTD) $4.8 billion Year-to-date figure
Adjusted EPS $1.33 Per share basis

The E&P Norway segment generated $9.2 billion in pre-tax adjusted operating income. Internationally, operating income nearly doubled despite a modest 4% production increase, reflecting improved portfolio quality. The Marketing, Midstream, and Power (MMP) segment contributed $777 million pre-tax, significantly exceeding the quarterly guidance of $400 million, driven by crude trading and high refinery margins at Mongstad.

Production and Operations

Total production reached 2,165,000 barrels per day, a 3% increase from Q2 2025. NCS production rose 4%, aided by new fields Irene and Simra coming on stream. Johan Sverdrup performed better than expected, with decline rates at the low end of the previously indicated 10% to 20% range.

Internationally, growth was led by Adura in the UK and Bacalhau in Brazil. This offset reductions from decreased ownership in Peregrino and the divestment of onshore Argentina assets. First-half production growth totaled 6%, reinforcing the full-year guidance.

In the power segment, Equinor produced 1.2 TWh, with growth stemming from Dogger Bank in the UK and new onshore assets.

Balance Sheet and Capital Allocation

Equinor strengthened its balance sheet, holding approximately $24 billion in cash and cash equivalents. The net debt ratio decreased to 10.4%, despite paying $7.1 billion in taxes, including three NCS installments totaling around $6.4 billion. Management expects the net debt ratio to fall below 10% by year-end.

Working capital decreased by $1.8 billion to $3.6 billion, a level lower than usual due to reduced inventories and accounts receivable.

Capital distribution initiatives included:

  • Doubling the 2026 share buyback program from $1.5 billion to $3 billion.
  • Approval of an ordinary cash dividend of $0.39 per share.
  • A third tranche of share buyback up to $1.125 billion, including the state’s share.

What the Numbers Show

The MMP segment’s pre-tax income of $777 million was nearly double the guided amount of $400 million. This significant outperformance was primarily driven by non-operational factors, specifically crude trading gains and elevated refinery margins at Mongstad, rather than core volume growth. This highlights the company’s ability to capture value from market volatility and tight product markets, though such results may fluctuate with geopolitical conditions.

Strategic Developments

Equinor awarded contracts for the first wave of tieback projects on the NCS under its new 2035 operating model, aiming to double development speed and halve costs. The company also took a final investment decision for the Greater Parche project in Angola, expected to generate more than $50 per barrel in cash flow from operations.

Additionally, Equinor received $150 million in quarterly cash distributions from Adura and recorded a gain of $467 million from the sale of Argentina onshore assets. Organic capital expenditure was $3.4 billion, resulting in positive net cash flow before distribution of $5.5 billion.

How might the new 2035 operating model's goal to halve costs impact Equinor's long-term capital expenditure efficiency and return on invested capital?

What are the potential risks to maintaining the 3% full-year production growth guidance if operational challenges at Johan Castberg persist or worsen?

Could the significant outperformance in the MMP segment due to trading gains and refinery margins be sustained, or is it likely to normalize as market volatility decreases?

like18
dislike

More News on Equinor ASA