

Epack Durable Q1FY27 revenue hits record ₹8,860 crore; PAT falls 48.5%


Epack Durable Limited delivered a record Q1FY27 revenue of ₹8,860 crore, up 34% YoY, driven by strong RAC sales and non-AC appliance growth. PAT fell 48.5% to ₹118 crore due to higher depreciation, finance costs, and a ₹7 crore forex loss. Reported EBITDA margins contracted 203 bps to 6.21%, but underlying margins improved 15 bps when adjusting for the absence of PLI income compared to the prior year. Management emphasized diversification efforts, with non-RAC revenue contributing 30% in the quarter, and confirmed capex plans totaling ~₹450 crore for FY27.


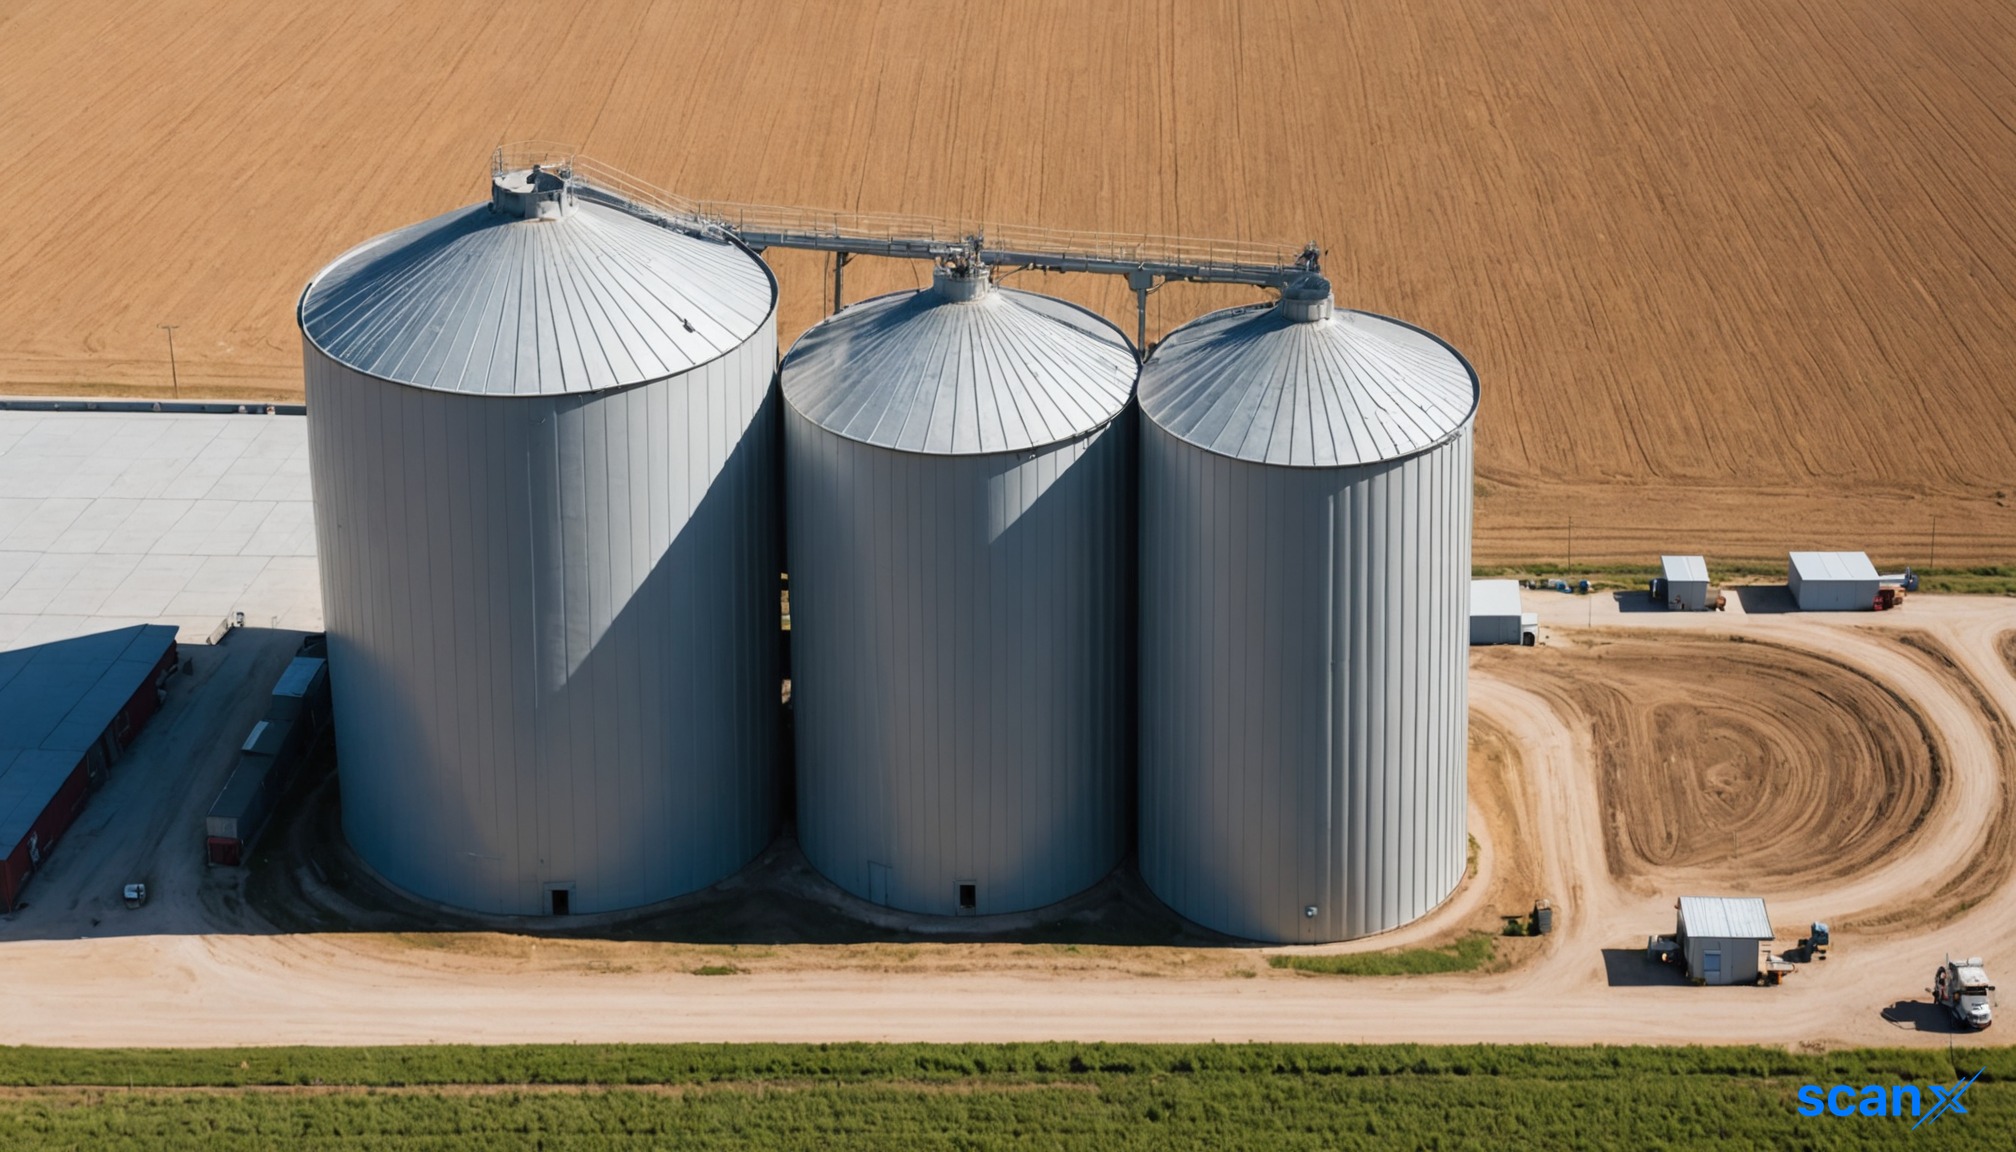
*this image is generated using AI for illustrative purposes only.
Epack Durable Limited reported a record consolidated revenue from operations of ₹8,860 crore for the quarter ended June 30, 2026 (Q1FY27), marking a 34% year-on-year increase. Despite the top-line surge driven by strong Room Air Conditioner (RAC) sales and expansion in small and large domestic appliances, Profit After Tax (PAT) declined sharply by 48.5% to ₹118 crore. The profit contraction was primarily caused by rising input costs, higher depreciation, increased finance expenses, a share of loss from its joint venture, and a significant forex loss of ₹7 crore.
Statutory auditors Deloitte Haskins & Sells issued a qualified opinion on the financials due to unresolved disputes over ₹196.1 lakh in trade receivables. The Board of Directors approved the standalone and consolidated unaudited financial results on August 11, 2026. In compliance with SEBI Listing Regulations, the company published newspaper advertisements in Financial Express and Jansatta Express on August 12, 2026, and re-appointed M/s Ernst & Young LLP as its Internal Auditor for FY27.
Financial Performance Highlights
Consolidated revenue from operations rose to ₹8,860 crore in Q1FY27 from ₹6,624 crore in Q1FY26. Standalone revenue reached ₹88,473.84 lakh. On the profitability front, consolidated EBITDA remained nearly flat at ₹550 crore versus ₹546 crore in the year-ago period, causing the reported EBITDA margin to contract by 203 basis points to 6.21% from 8.24%. However, management clarified that this comparison is distorted by the absence of Production Linked Incentive (PLI) income in the current quarter, unlike the ₹133 crore accrued in Q1FY26. Excluding PLI effects, the underlying EBITDA margin improved by approximately 15 basis points year-on-year.
| Metric | Consolidated Q1FY27 | Consolidated Q1FY26 | Standalone Q1FY27 | Standalone Q1FY26 |
|---|---|---|---|---|
| Revenue from Operations (₹ crore) | 8,860.24 | 6,623.93 | 8,847.38 | 6,623.93 |
| Net Profit (₹ crore) | 118.18 | 228.91 | 220.15 | 238.57 |
| Earnings Per Share (₹) | 1.23 | 2.39 | 2.29 | 2.49 |
| EBITDA Metric | Q1FY27 | Q1FY26 | Change |
|---|---|---|---|
| EBITDA (₹ crore) | 550 | 546 | +0.73% YoY |
| EBITDA Margin (%) | 6.21 | 8.24 | -203 bps YoY |
Segment-Wise Revenue Growth
The revenue expansion was broad-based across key segments. RAC revenue grew 43.8% to ₹6,221 crore, with management attributing the growth to a 30% volume increase and 14% value growth from price pass-throughs. Small and Large Domestic Appliances (SDA & LDA) revenue surged 68.9% to ₹1,314 crore, led by strong traction in air-fryers and washing machines. Conversely, the Components segment saw a 23.1% decline to ₹853 crore due to a high base effect, while Other revenues grew 15.1% to ₹472 crore. No PLI income was recognized in Q1FY27.
Auditor Qualification and Receivables Risk
The qualified audit opinion stems from a disputed balance of ₹196.1 lakh included in trade receivables. The holding company believes there is a high probability of recovery and has not recognized any provision against these dues. Deloitte Haskins & Sells stated that, given the legal dispute and lack of sufficient evidence regarding the customer's ability to pay, they could not determine if adjustments to the carrying amount of trade receivables or allowances for expected credit loss were required. This qualification was also present in the reports for the quarter and year ended March 31, 2026.
Strategic Outlook and Diversification
Epack Durable is actively diversifying its revenue mix to reduce dependency on RAC. Non-RAC contribution rose from 20% in FY23 to 45% in FY26. In Q1FY27, non-RAC segments accounted for approximately 30% of revenue, a figure management attributes to seasonal RAC peaks rather than a reversal of the diversification trend. Top-customer concentration has fallen significantly from 72% in FY23 to 38% in Q1FY27. The company continues its strategic capex program, with ₹102 crore spent in Q1FY27 towards localization and backward integration. Management expects total capex for FY27 to reach approximately ₹450-470 crore, with ₹60-70 crore remaining in pipeline.
What the Numbers Show
The divergence between reported and underlying margins highlights the transitional impact of expiring government incentives. While the reported EBITDA margin contracted by 203 basis points, the exclusion of ₹133 crore in PLI income from the prior year reveals an underlying operational improvement of 15 basis points. This suggests that core pricing power and cost management are stabilizing, even as the company faces headwinds from forex volatility and increased depreciation from new capacity additions. The significant rise in other expenses, driven largely by a ₹7 crore forex loss, underscores the currency risk exposure in a global supply chain environment.
What This Means for Investors
While top-line growth is robust, the qualified audit opinion introduces uncertainty regarding asset quality. The ₹196.1 lakh disputed receivable represents a material risk if recovery proves difficult, potentially impacting future provisions and net margins. The contraction in reported EBITDA margin to 6.21% signals ongoing cost pressures even as revenues scale. Investors should monitor management's commentary on the legal proceedings, the progress of margin recovery initiatives, and the normalization of working capital as inventory levels adjust post-season.
Historical Stock Returns for Epack Durable
| 1 Day | 5 Days | 1 Month | 6 Months | 1 Year | 5 Years |
|---|---|---|---|---|---|
| +3.22% | -0.65% | -9.02% | -28.84% | -50.05% | -19.07% |

How might the expiration of Production Linked Incentive (PLI) subsidies impact Epack Durable's long-term margin trajectory and pricing strategy in FY27?
What specific legal or commercial steps is management taking to resolve the disputed ₹196.1 lakh trade receivable that led to the qualified audit opinion?
Given the sharp rise in forex losses, what hedging strategies or supply chain adjustments will Epack Durable implement to mitigate currency volatility risks?
 19
19






 Create Custom Screeners
  Access 200+ Pre-built Filters
  Use 50+ Readymade Screener





