

Custom Truck One Source Q2FY26 Results: Revenue up 10% to $563 million, EBITDA up 25%


- Record Q2 revenue of $563 million, up 10% YoY, and Adjusted EBITDA of $117 million, up 25% YoY.
- Raised full-year 2026 guidance to revenue of $2.1-$2.2 billion and Adjusted EBITDA of $437.5-$455 million.
- SER segment utilization hit 81.6%, up 400 bps YoY, with OEC on rent rising 13% to $1.37 billion.
- STEM segment posted record third-party revenue of $345 million, though backlog dipped to $322 million on strong deliveries.
- Net leverage improved to 3.85x, down more than 0.8 turns YoY, with levered free cash flow up $40 million in H1.

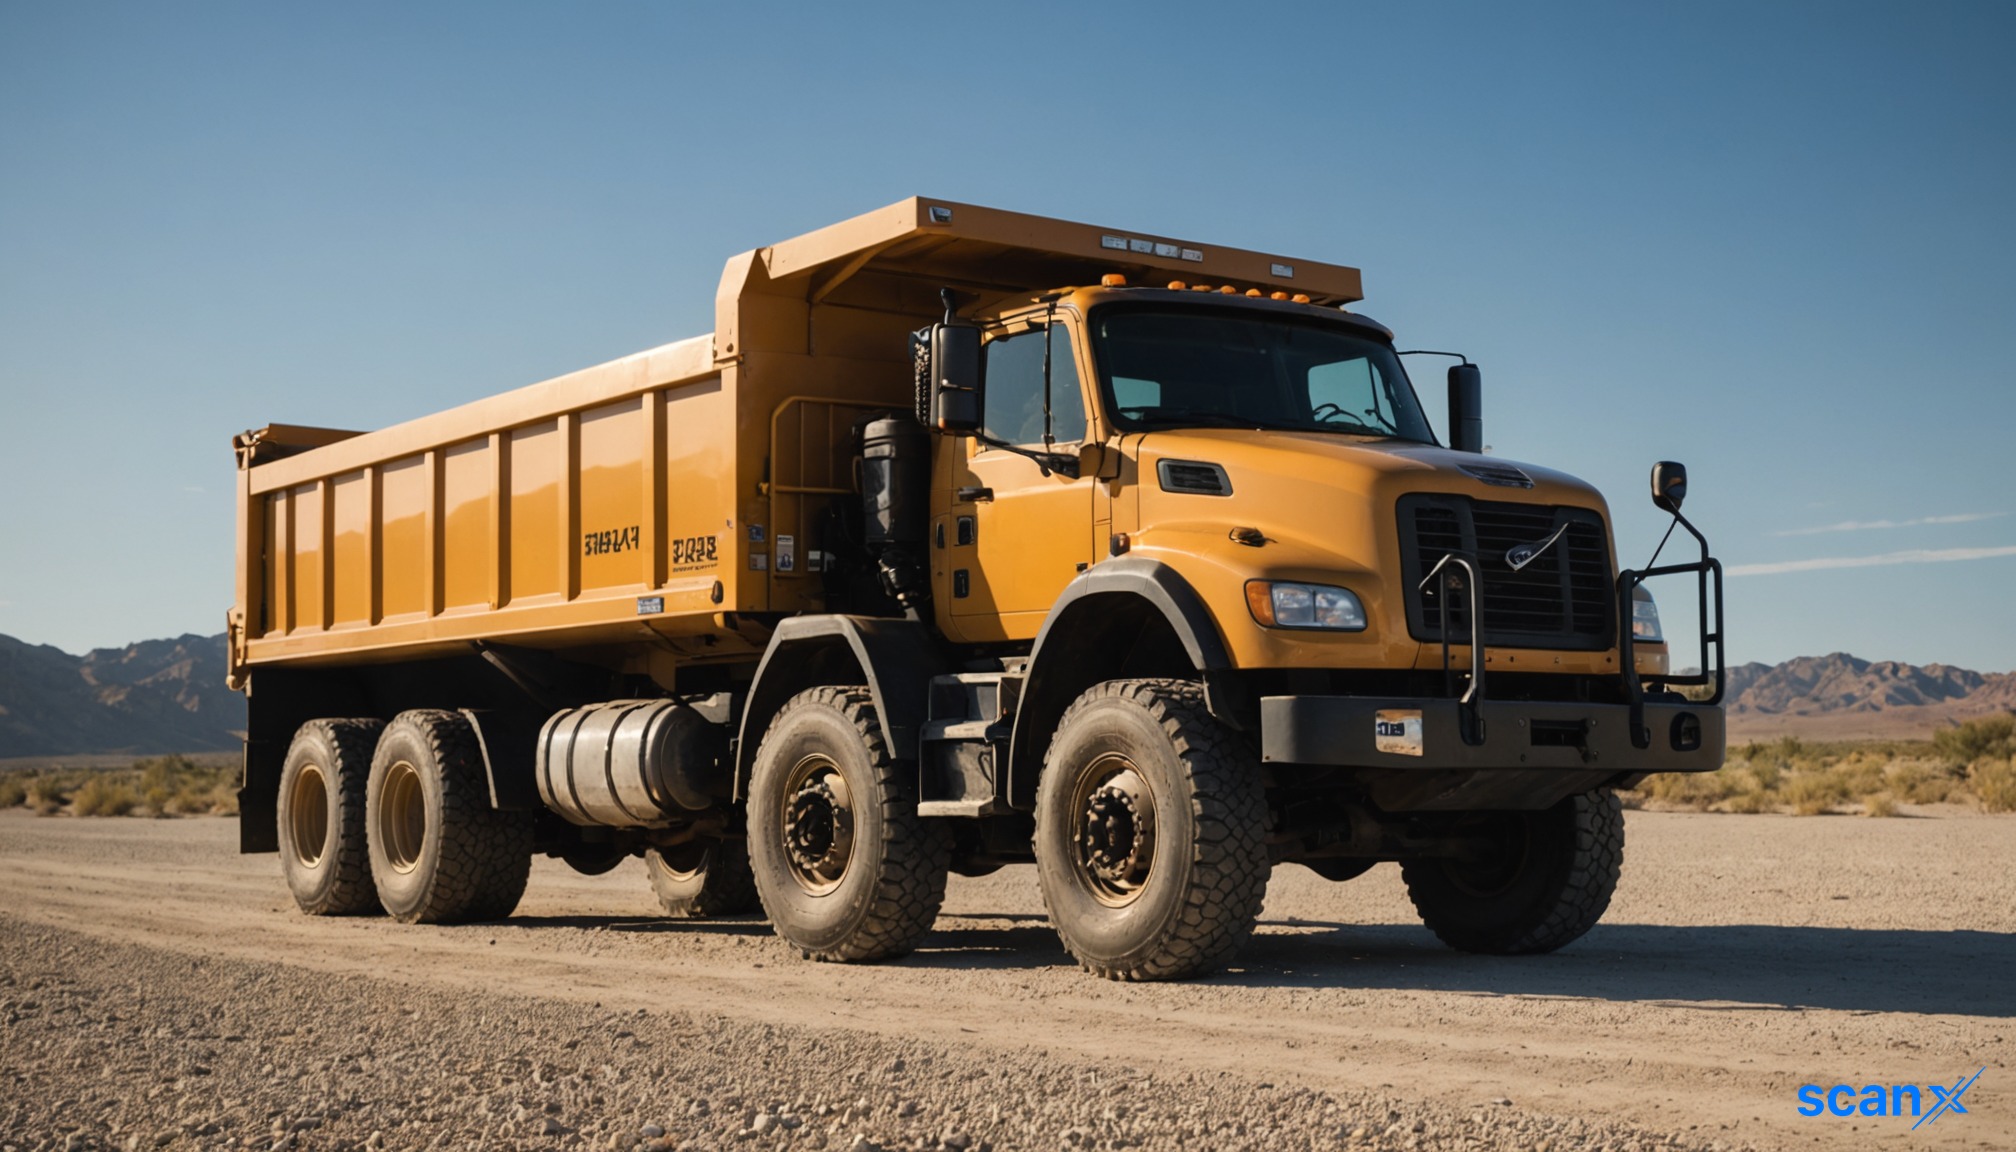

*this image is generated using AI for illustrative purposes only.
Custom Truck One Source (NYSE: CTOS) reported record second-quarter revenue of $563 million, a 10% increase year over year. Adjusted EBITDA rose 25% to $117 million, driven by strong performance in the Specialty Equipment Rentals segment and record equipment sales in the Specialty Truck segment.
The company raised its full-year 2026 guidance, now projecting consolidated revenue between $2.1 billion and $2.2 billion and Adjusted EBITDA between $437.5 million and $455 million. This upward revision reflects sustained demand in transmission and distribution markets and robust order flow in truck equipment manufacturing.
Segment Performance Highlights
The Specialty Equipment Rentals (SER) segment delivered third-party revenue of $219 million, up 20% YoY. Segment Adjusted EBITDA margin expanded by more than 700 basis points to 53%. Key rental metrics showed significant improvement:
- Average fleet utilization reached 81.6%, up 400 basis points YoY.
- Original Equipment Cost (OEC) on rent averaged $1.37 billion, up 13% YoY.
- Total OEC in the rental fleet ended the quarter at $1.68 billion, a historical high.
The Specialty Truck, Equipment and Manufacturing (STEM) segment achieved record quarterly third-party revenue of $345 million, up 5% YoY. New sales backlog stood at $322 million at quarter-end, down $89 million sequentially due to record deliveries, though intra-quarter order flow remained strong with quoting activity up 26% YoY.
Financial Metrics Overview
| Metric | Q2FY26 | Q2FY25 | Change |
|---|---|---|---|
| Total Revenue | $563 million | N/A | +10% |
| Adjusted EBITDA | $117 million | N/A | +25% |
| Net Income | $10 million | -$28 million | Swing to Profit |
| SER Utilization | 81.6% | 77.6% | +400 bps |
| OEC on Rent | $1.37 billion | $1.21 billion | +13% |
| Net Leverage Ratio | 3.85x | 4.65x | -0.8x |
What the Numbers Show
A divergence exists between STEM’s backlog decline and its revenue growth. While new sales backlog fell $89 million sequentially to $322 million, this reduction was attributed to record deliveries rather than weak demand. Management noted that intra-quarter order flow remains strong, with backlog growing so far in Q3 to over $340 million. This suggests that the backlog decrease reflects efficient conversion of orders into revenue rather than a slowdown in customer interest, supported by June quoting activity rising 26% YoY.
Balance Sheet and Outlook
Net leverage improved to 3.85 times at quarter-end, down from approximately 4.65 times a year ago. Levered free cash flow improved by approximately $40 million in the first half compared to the prior-year period. The company expects to reduce net leverage to meaningfully below 4 times by year-end 2026.
Management highlighted a "once-in-a-generation" transmission demand super cycle as a key driver for continued growth. Despite macroeconomic uncertainty, the company maintains confidence in long-term demand drivers, particularly in utility and infrastructure sectors.

How will the projected decline in net leverage below 4.0x by year-end 2026 impact CTOS's capital allocation strategy, specifically regarding fleet expansion versus debt repayment?
Given the 26% YoY increase in quoting activity, what is the expected conversion rate of these quotes into firm orders for the second half of 2026?
To what extent does the 'once-in-a-generation' transmission super cycle rely on specific federal infrastructure legislation or utility capex plans that could face regulatory delays?
 18
18







 Create Custom Screeners
  Access 200+ Pre-built Filters
  Use 50+ Readymade Screener





