Creative Castings FY26 Net Profit Rises 20.4% to ₹437 Lakhs


Creative Castings Limited reported a 20.4% increase in net profit to ₹437.05 lakhs for FY26, with revenue from operations rising to ₹4,827.51 lakhs. For Q4 FY26, net profit was ₹101.98 lakhs on revenue of ₹1,142.73 lakhs. The Board approved the re-appointment of the internal auditor and adopted the Annual Secretarial Compliance Report.

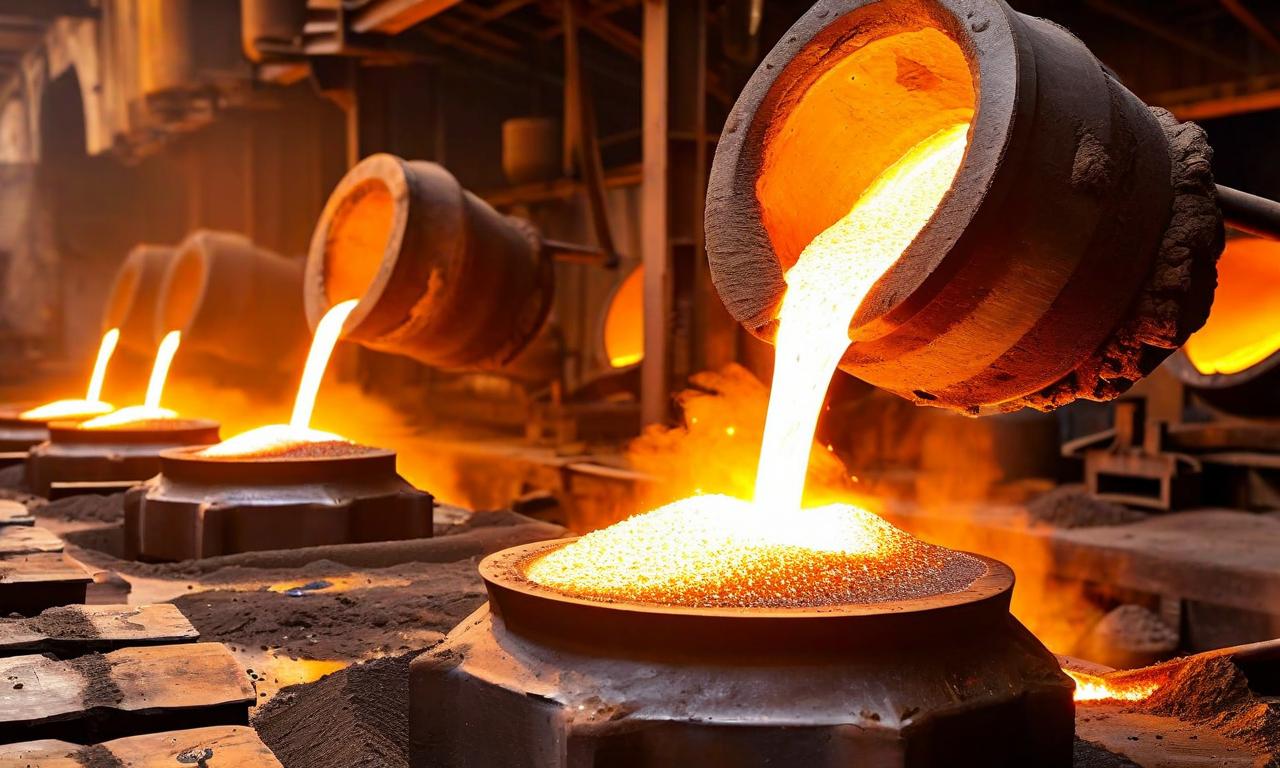
*this image is generated using AI for illustrative purposes only.
Creative Castings Limited reported its audited standalone financial results for the quarter and financial year ended March 31, 2026. The Board of Directors approved the results at its meeting held on May 16, 2026. The company does not have any subsidiary, associate, or joint venture, and accordingly, only standalone results were submitted.
Annual Financial Performance
The company recorded a 20.4% increase in net profit for FY26, which rose to ₹437.05 lakhs from ₹362.92 lakhs in the previous year. Revenue from operations grew to ₹4,827.51 lakhs from ₹4,351.35 lakhs in FY25. Total income for the year stood at ₹4,985.28 lakhs, compared to ₹4,463.34 lakhs in the prior year. Total comprehensive income for FY26 was ₹460.74 lakhs, against ₹408.36 lakhs in FY25.
| Metric | FY26 (₹ in Lakhs) | FY25 (₹ in Lakhs) |
|---|---|---|
| Revenue from Operations | 4,827.51 | 4,351.35 |
| Total Income | 4,985.28 | 4,463.34 |
| Total Expenses | 4,356.77 | 3,931.45 |
| Net Profit | 437.05 | 362.92 |
| Basic EPS (₹) | 33.62 | 27.92 |
Quarterly Highlights
For the quarter ended March 31, 2026, revenue from operations stood at ₹1,142.73 lakhs, compared to ₹1,062.98 lakhs in the corresponding quarter of the previous year. Net profit for Q4 FY26 was ₹101.98 lakhs, versus ₹104.65 lakhs in Q4 FY25. Basic and diluted EPS for the quarter were ₹7.84.
| Metric | Q4 FY26 (₹ in Lakhs) | Q4 FY25 (₹ in Lakhs) |
|---|---|---|
| Revenue from Operations | 1,142.73 | 1,062.98 |
| Total Income | 1,181.99 | 1,091.13 |
| Net Profit | 101.98 | 104.65 |
Board Decisions
The Board approved the re-appointment of M/s. Subhash Akbari & Co., Chartered Accountants, as Internal Auditor for the financial year 2026-27. Additionally, the Board adopted the Annual Secretarial Compliance Report issued by M/s. M. Buha & Co. for FY26 and approved related party transactions.
Historical Stock Returns for Creative Castings
| 1 Day | 5 Days | 1 Month | 6 Months | 1 Year | 5 Years |
|---|---|---|---|---|---|
| +2.70% | 0.0% | 0.0% | +8.36% | -8.45% | -4.57% |
Given the sequential decline in Q4 FY26 revenue and net profit compared to Q3 FY26, what factors could explain the seasonal weakness and whether this trend is likely to persist into Q1 FY27?
With total expenses growing at a faster pace (~10.8%) than revenue (~10.9%) in FY26, how sustainable is Creative Castings' profit margin expansion in the face of potential raw material cost pressures in the castings industry?
As Creative Castings has maintained a stable equity share capital of ₹130 lakhs with no subsidiaries or joint ventures, are there any plans for capacity expansion, acquisitions, or diversification that could accelerate growth beyond the current organic trajectory?
 20
20