

Creative Castings net profit surges 114% in Q1FY27, recommends 125% dividend


Creative Castings posted a 113.6% YoY rise in Q1FY27 net profit to ₹158.10 lakh, fueled by 54.4% revenue growth to ₹1,397.38 lakh. The Board recommended a 125% final dividend for FY26. Operational leverage improved as expenses grew at 43.0%, slower than revenue. Comparative figures were restated for internal energy transfers, with no impact on bottom-line metrics.


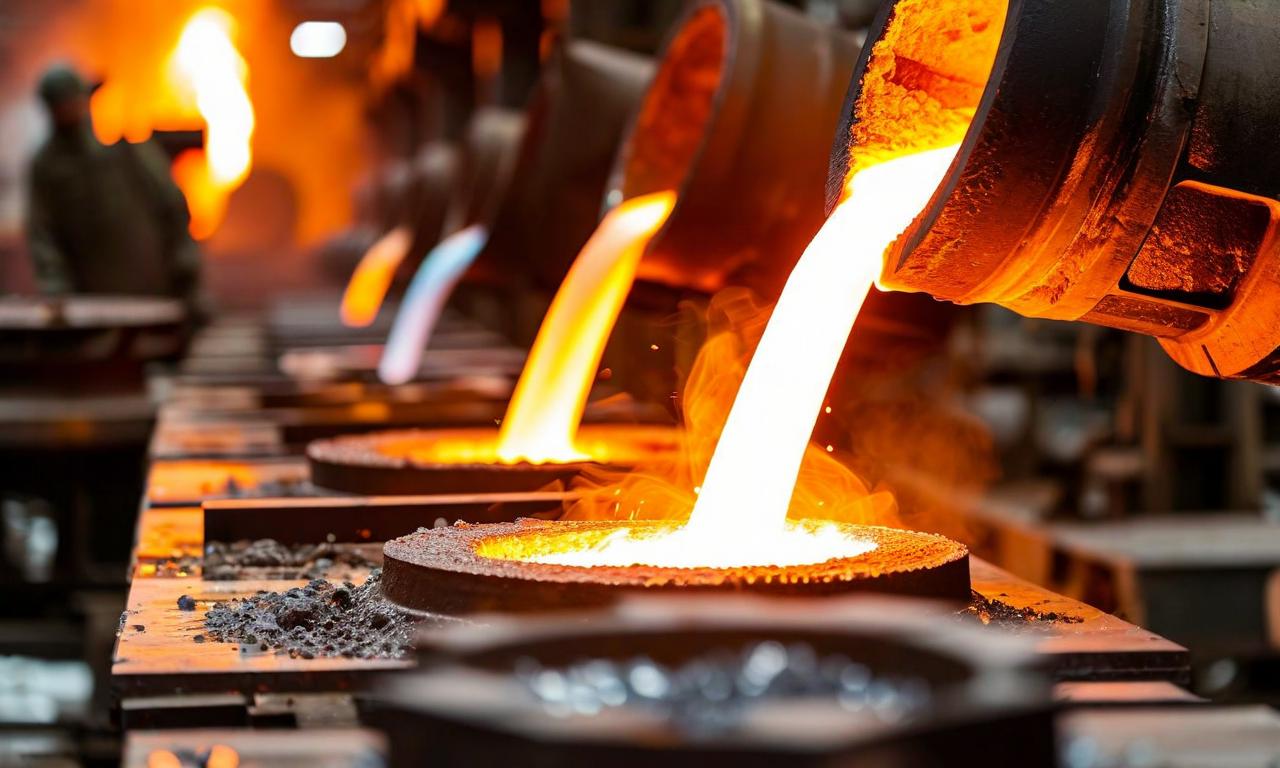
*this image is generated using AI for illustrative purposes only.
Creative Castings Limited reported a net profit of ₹158.10 lakh for the quarter ended June 30, 2026, marking a significant 113.6% increase from ₹74.03 lakh in the corresponding period of FY25. This surge in profitability was primarily driven by a 54.4% year-on-year rise in revenue from operations, which climbed to ₹1,397.38 lakh from ₹905.27 lakh. The strong top-line growth translated directly into higher earnings per share (EPS), which stood at ₹12.16, compared to ₹5.69 in the previous year’s quarter. For shareholders, this performance underscores robust operational momentum and led the Board to recommend a final dividend of 125%, or ₹12.50 per equity share of ₹10 each, for the financial year 2025-26.
The Board of Directors, meeting on August 1, 2026, approved these standalone unaudited financial results, which were reviewed by the Audit Committee and subjected to a limited review by statutory auditors J C Ranpura & Co. The company published the results in newspapers on August 2, 2026, pursuant to Regulation 47 of the SEBI (Listing Obligations and Disclosure Requirements) Regulations, 2015. The advertisement appeared in Western Times (English edition) and Western Times (Gujarati edition), providing access to the complete audited financial results via QR code and webpage links. The final dividend recommendation is subject to shareholder approval at the upcoming 41st Annual General Meeting.
Financial Performance Highlights
The company’s operational efficiency improved alongside revenue growth. Total income for the quarter reached ₹1,450.53 lakh, up from ₹946.65 lakh in Q1FY25. While total expenses increased to ₹1,234.73 lakh from ₹862.99 lakh, the profit before tax expanded significantly to ₹215.80 lakh from ₹83.66 lakh. Other income contributed ₹53.15 lakh, compared to ₹41.38 lakh in the prior year quarter. Year-to-date figures for the full year ended March 31, 2026, show total income of ₹4,865.72 lakh and a net profit of ₹437.05 lakh.
| Particulars | Q1FY27 (₹ in Lakhs) | Q1FY26 (₹ in Lakhs) | YoY Change |
|---|---|---|---|
| Revenue from Operations | 1,397.38 | 905.27 | +54.4% |
| Total Income | 1,450.53 | 946.65 | +53.2% |
| Total Expenses | 1,234.73 | 862.99 | +43.0% |
| Profit Before Tax | 215.80 | 83.66 | +158.0% |
| Net Profit | 158.10 | 74.03 | +113.6% |
| EPS (Basic) | ₹12.16 | ₹5.69 | +113.7% |
Restatement of Comparative Figures
The filing includes a material restatement of comparative financial data for prior periods. Management reassessed the presentation of electricity generated through captive wind-power facilities and consumed internally in casting operations. Previously reported on a gross basis, these internal transfers have been eliminated from both "Revenue from Operations" and "Other Expenses" to reflect net economic activity.
For the quarter ended March 31, 2026, revenue was restated downward by ₹21.94 lakh to ₹1,120.79 lakh, with a corresponding reduction in other expenses. Similarly, full-year FY25-26 revenue was adjusted by ₹119.56 lakh. The company clarified that this restatement affects only the gross presentation of internal transfers and has no impact on profit before tax, net profit, or earnings per share for any period.
What the Numbers Show
The divergence between revenue growth (54.4%) and expense growth (43.0%) indicates improved operating leverage in Q1FY27. While cost of materials consumed rose sharply to ₹516.92 lakh from ₹330.07 lakh, the company managed to contain employee benefits and finance costs relative to revenue. The doubling of profit before tax (158% increase) versus revenue growth suggests that fixed costs are being spread over a larger output base, enhancing margin expansion. The decision to increase the dividend payout ratio aligns with this strengthened cash flow position.
Historical Stock Returns for Creative Castings
| 1 Day | 5 Days | 1 Month | 6 Months | 1 Year | 5 Years |
|---|---|---|---|---|---|
| -8.41% | 0.0% | 0.0% | 0.0% | -4.54% | -3.98% |

Will the restatement of captive wind-power electricity from gross to net basis affect future comparability of revenue growth metrics for analysts?
How sustainable is the current operating leverage given the sharp rise in material costs, and what hedging strategies are in place for raw material price volatility?
What is the expected timeline for shareholder approval of the 125% final dividend at the 41st AGM, and how might this impact short-term stock liquidity?
 17
17







 Create Custom Screeners
  Access 200+ Pre-built Filters
  Use 50+ Readymade Screener





