

Buckle Q2FY26 Results: Net sales rise 4.6%, gross margin expands to 47.8%


- Net sales rose 4.6% YoY to $319.8 million, driven by 2.1% comparable store sales growth
- Gross margin expanded to 47.8%, aided by 65 bps from tariff refunds and private label strength
- Operating margin contracted to 17.4% as SG&A expenses rose to 30.4% of sales due to marketing and labor costs
- Women's apparel grew 9.5%, while men's business remained flat and footwear saw minimal growth
- Inventory increased 13.3% to $161.4 million; cash and investments totaled $322.9 million

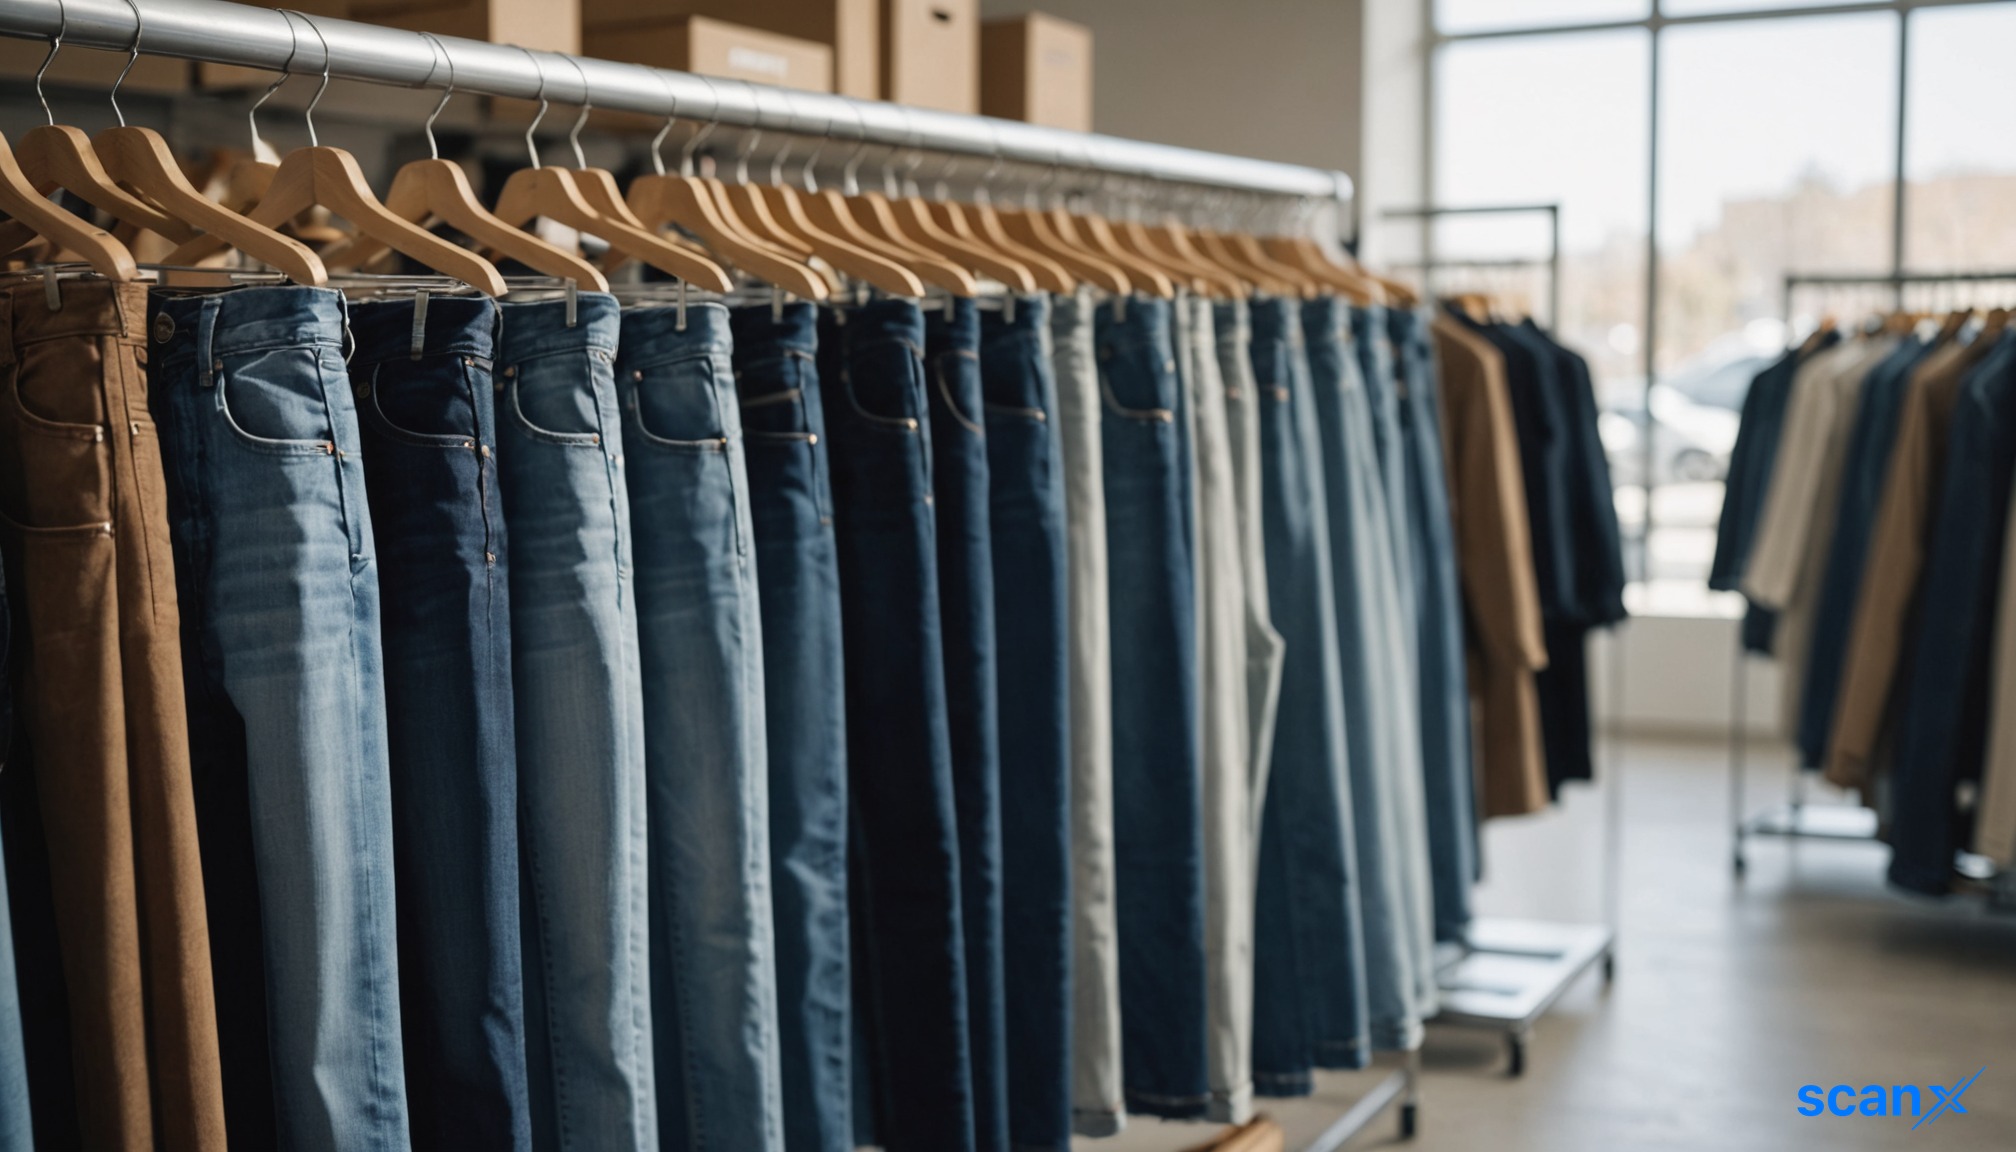

*this image is generated using AI for illustrative purposes only.
Buckle Inc. (NYSE: BKE) reported a 4.6% year-over-year increase in second-quarter net sales to $319.8 million for the 13-week period ended August 1, 2026. Comparable store sales rose 2.1%, supported by a 4.5% increase in average unit retail prices that offset a 1% decline in units per transaction.
Financial Performance
Net income fell slightly to $44.4 million, or $0.87 per diluted share, from $45.0 million, or $0.89 per share, in the prior-year quarter. Year-to-date net income increased to $91.3 million, compared to $80.2 million in the same period last year.
| Metric | Q2FY26 | Q2FY25 | Change |
|---|---|---|---|
| Net Sales | $319.8 million | $305.7 million | +4.6% |
| Net Income | $44.4 million | $45.0 million | -1.3% |
| Gross Margin | 47.8% | 47.4% | +40 bps |
| Operating Margin | 17.4% | 18.4% | -100 bps |
| SG&A Expense | 30.4% of sales | 29.0% of sales | +140 bps |
Gross margin expanded by 40 basis points to 47.8%, driven by an 110-basis-point improvement in merchandise margins. This improvement included a 65-basis-point impact from $2.5 million in tariff refunds received during the quarter. The merchandise margin gain was partially offset by a 70-basis-point increase in buying, distribution, and occupancy expenses linked to new and relocated stores.
Selling, general, and administrative (SG&A) expenses rose to 30.4% of net sales from 29.0% in the prior year. This deleverage was primarily due to a 45-basis-point increase in marketing spend aimed at guest acquisition and a 35-basis-point rise in store labor costs. These increases were partially offset by a 35-basis-point reduction in incentive compensation accruals.
What the Numbers Show
The divergence between gross margin expansion and operating margin contraction highlights the cost pressure on marketing and labor. While merchandise margins improved significantly—aided by non-recurring tariff refunds and private label strength—these gains were fully absorbed by higher SG&A expenses. Marketing costs rose both due to increased investment across channels like CTV and social media, and because of rising provider costs, indicating a structural increase in customer acquisition expenses rather than just tactical spending.
Category Performance
Women’s apparel drove growth, increasing 9.5% year-over-year to represent 50% of total sales. Denim grew 11%, with average price points rising from $85.35 to $92.50. Alternative pants surged nearly 50%, fueled by demand for wider-leg silhouettes. Men’s business remained flat, with total sales representing 50% of revenue. Men’s denim declined 3.5%, though private label denim outperformed national brands. Footwear sales increased only 0.5%, continuing a long-term volume decline trend noted by management.
Kids’ business grew 11%, with denim accounting for 35.5% of category sales. Private label products represented 44.5% of total company sales, up from 43.5% in the prior year.
Store Operations and Balance Sheet
The company opened five new stores and completed five remodels in the quarter, ending with 446 retail locations. Capital expenditures for the quarter totaled $29.8 million, including $24.4 million for store construction and technology upgrades. Inventory rose 13.3% to $161.4 million, while total cash and investments stood at $322.9 million as of August 1, 2026.

How sustainable is the 40-basis-point gross margin expansion once the non-recurring $2.5 million in tariff refunds expires?
What specific strategies will Buckle employ to offset the structural rise in customer acquisition costs driven by CTV and social media provider fees?
Can the strong momentum in women's alternative pants and denim sustain growth, or will volume declines in footwear and men's apparel drag down overall comparable store sales?
 15
15









 Create Custom Screeners
  Access 200+ Pre-built Filters
  Use 50+ Readymade Screener





