Blue Star has released its Q4FY26 and FY26 earnings call transcript under Regulation 30 of the SEBI Listing Obligations and Disclosure Requirements Regulations, following the Board-approved financial results for the fourth quarter and full financial year ended March 31, 2026. The earnings call, held on May 7, 2026, was conducted by Managing Director Mr. B. Thiagarajan and Group CFO Mr. Nikhil Sohoni, with the transcript subsequently filed with stock exchanges on May 12, 2026. The audio recording of the call is also available on the company's official website.
Q4FY26 Financial Performance
Blue Star reported consolidated revenue from operations growth of 1.3% in Q4FY26, with the company posting its highest-ever quarterly revenue for the period. EBITDA rose 17% to ₹326 crores, with EBITDA margin improving to 8.0% from 7.0% in Q4FY25. Profit Before Tax (PBT) before exceptional items was higher at ₹282.60 crores in Q4FY26 compared to ₹248.80 crores in Q4FY25. Net profit stood at ₹227.20 crores in Q4FY26 compared to ₹194 crores in Q4FY25. Earnings per share (EPS) for Q4FY26 stood at ₹11.05, compared to ₹9.44 in Q4FY25.
| Metric: |
Q4FY26 |
Q4FY25 |
Change (%) |
| Total Revenue (₹ cr) |
4072 |
4019 |
+1.3% |
| EBITDA (₹ cr) |
326 (8.0%) |
279 (7.0%) |
+17% |
| PBT^ (₹ cr) |
282.60 |
248.80 |
— |
| Net Profit (₹ cr) |
227.20 |
194 |
— |
| EPS (₹)* |
11.05 |
9.44 |
— |
*Not Annualized
^before exceptional items
FY26 Full-Year Financial Performance
For the full year FY26, revenue grew 3.6% to ₹12,402 crores compared to ₹11,967.60 crores in FY25. EBITDA rose 6.2% to ₹930.40 crores, with EBITDA margin improving to 7.5% from 7.3% in FY25, mainly owing to overall focus on cost management. PBT before exceptional items de-grew 3.9% to ₹741.90 crores compared to ₹772.40 crores in FY25. Net profit for FY26 de-grew to ₹527.30 crores (4.3% of revenue) compared to ₹591.30 crores (4.9% of revenue) in FY25. Full-year EPS stood at ₹25.65, compared to ₹28.76 in FY25. The company recognised a one-time exceptional expense of ₹38.83 crores towards gratuity and compensated absences pursuant to new Labour Codes. Tax expense for FY26 was ₹175.80 crores compared to ₹193.60 crores in FY25, with an effective tax rate of 25% for FY26 versus 24.7% for FY25. The Board of Directors recommended a dividend of ₹8.50 per share for FY26, compared to ₹9 per share in the prior year.
| Metric: |
FY26 |
FY25 |
Change (%) |
| Total Revenue (₹ cr) |
12402 |
11967.60 |
+3.6% |
| EBITDA (₹ cr) |
930.40 (7.5%) |
875.90 (7.3%) |
+6.2% |
| PBT^ (₹ cr) |
741.90 |
772.40 |
-3.9% |
| Net Profit (₹ cr) |
527.30 |
591.30 |
-4.3% |
| EPS (₹) |
25.65 |
28.76 |
— |
| Dividend per Share (₹) |
8.50 |
9.00 |
— |
^before exceptional items
Blue Star's carried forward order book stood at ₹6,923 crores as of March 31, 2026, compared to ₹6,263 crores as of March 31, 2025, reflecting growth of 10.5%. Capital employed as of March 31, 2026 increased to ₹3,258 crores compared to ₹2,427 crores as of March 31, 2025.
Segment-Wise Performance
The following tables present a detailed breakdown of segment revenues and EBIT margins for both Q4FY26 and FY26.
| Segment: |
Q4FY26 Revenue (₹ cr) |
Q4FY25 Revenue (₹ cr) |
EBIT Margin Q4FY26 |
EBIT Margin Q4FY25 |
| Electro-Mechanical |
1989.90 |
1968.20 |
6.5% |
7.6% |
| Unitary Products |
1985 |
1960.20 |
10.4% |
8.4% |
| Professional & Industrial |
97.18 |
90.56 |
14.7% |
9.7% |
| Segment: |
FY26 Revenue (₹ cr) |
FY25 Revenue (₹ cr) |
EBIT Margin FY26 |
EBIT Margin FY25 |
| Electro-Mechanical |
6762.80 |
5998 |
7.4% |
8.2% |
| Unitary Products |
5332.40 |
5621.10 |
8.2% |
8.4% |
| Professional & Industrial |
306.80 |
348.60 |
11.4% |
8.5% |
In Q4FY26, the Electro-Mechanical Projects and Commercial Air Conditioning segment saw order inflow grow 35.7% to ₹1,954.39 crores compared to ₹1,439.99 crores in Q4FY25, driven by strong enquiry momentum from buildings, data centers, and factories. The carry forward order book of the Electromechanical Projects business stood at ₹4,664.50 crores as of March 31, 2026, compared to ₹4,755.20 crores as of March 31, 2025. For the full year, order inflow was lower by 10% compared to FY25 as inflow was sluggish in previous quarters. The Unitary Products segment reported improved Q4FY26 margins of 10.4% versus 8.4% in Q4FY25, aided by cost rationalisation measures, prudent pricing, and delayed onset of summer season which deferred advertising and field marketing spend. The Professional Electronics and Industrial Systems segment saw revenue grow 7.3% to ₹97.18 crores in Q4FY26, with EBIT margin improving significantly to 14.7% from 9.7%.
Balance Sheet Position – FY26
Blue Star's balance sheet reflects increased investment activity during FY26. Net cash position declined to ₹175.50 crores from ₹640.30 crores in FY25. Net worth improved to ₹3,431 crores from ₹3,064 crores. The debt-equity ratio rose to 0.18 from 0.07, while capital turns moderated to 4.4 times from 5.2 times in FY25.
| Metric: |
FY26 |
FY25 |
| Net Cash Position (₹ cr) |
175.50 |
640.30 |
| Net Worth (₹ cr) |
3431 |
3064 |
| Debt Equity Ratio |
0.18 |
0.07 |
| Capital Turns (Times) |
4.4 |
5.2 |
Business Segment Highlights
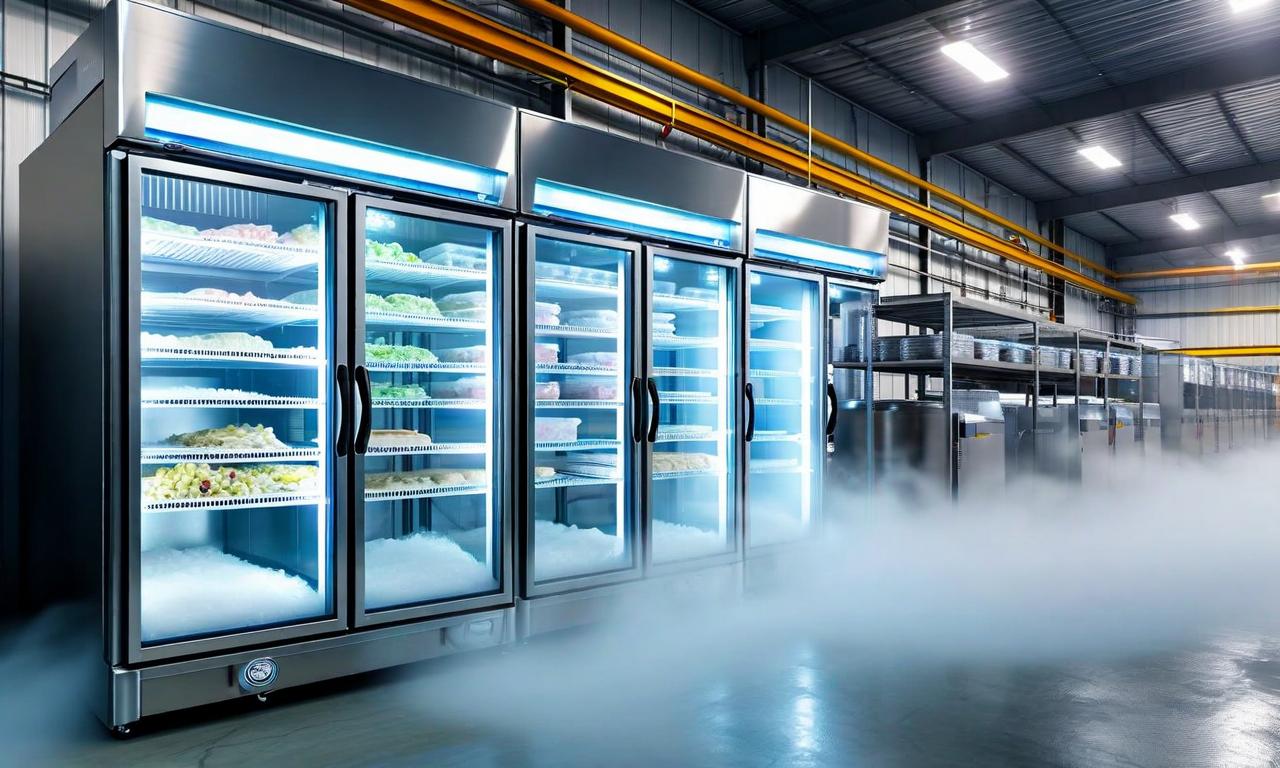
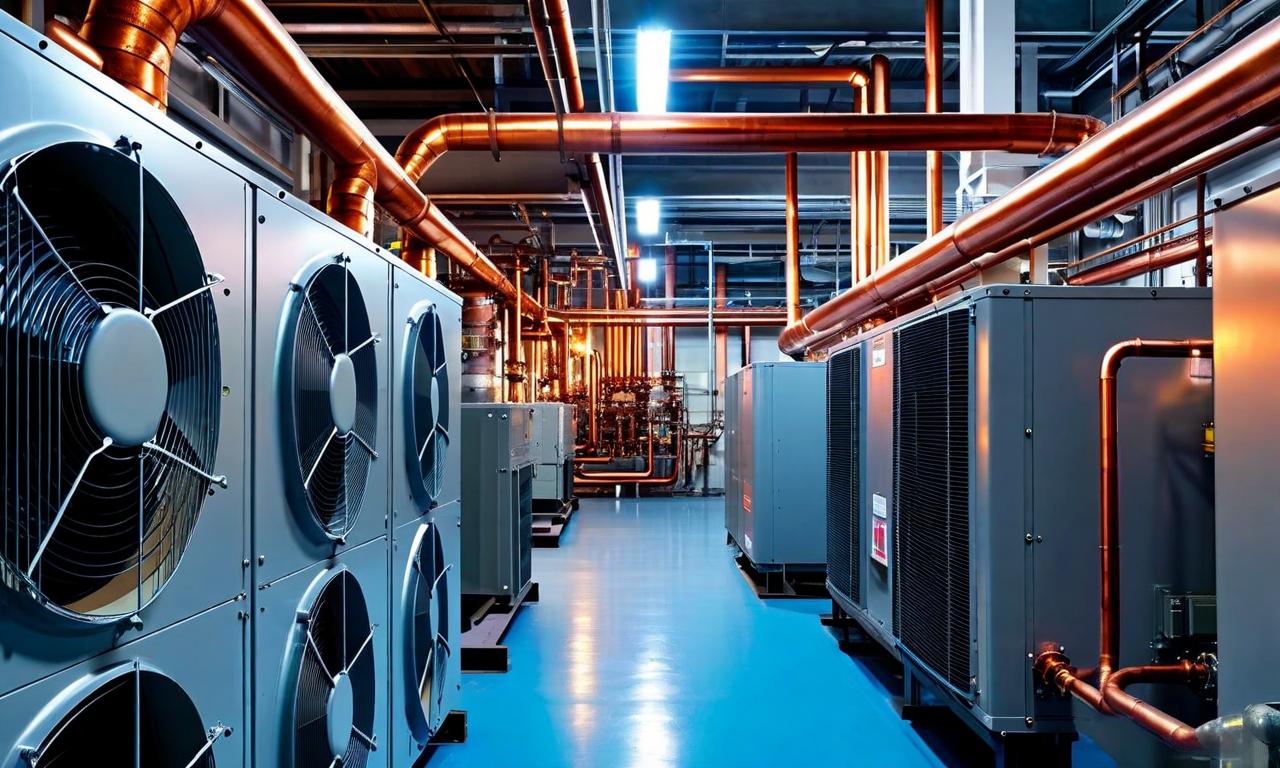
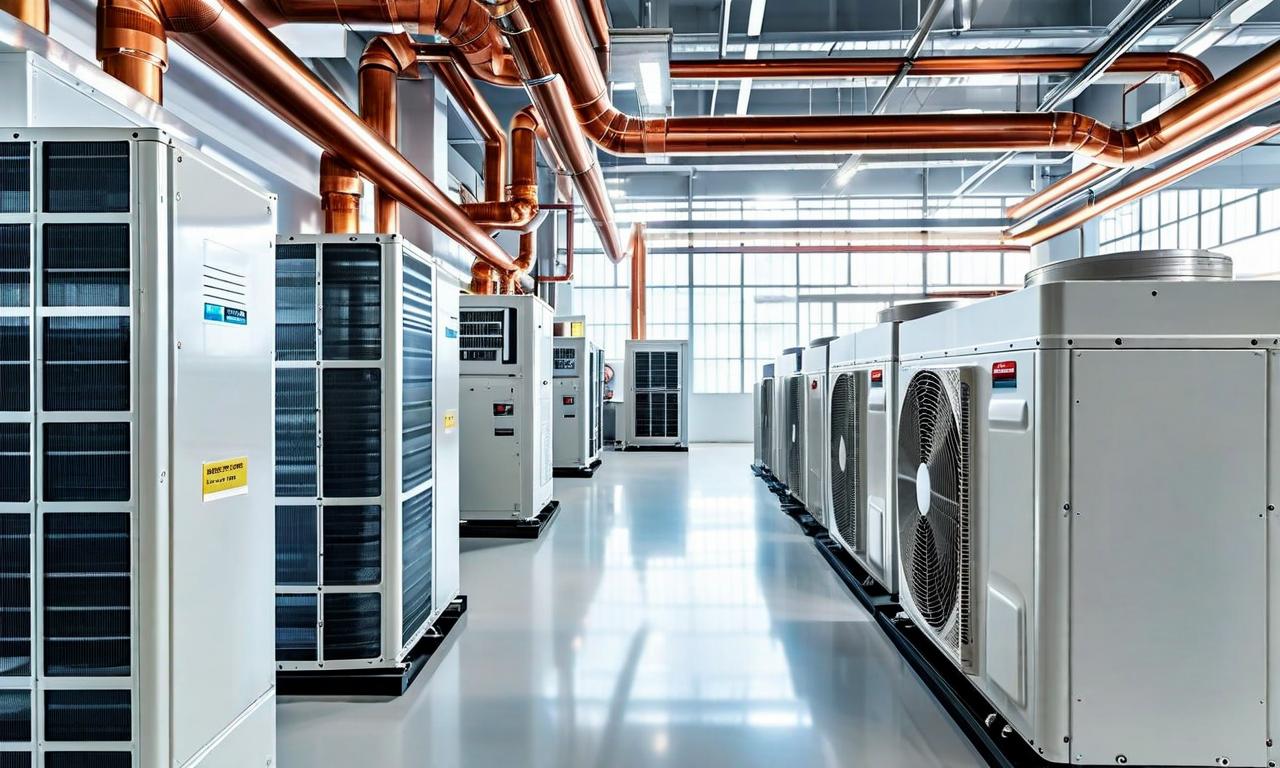
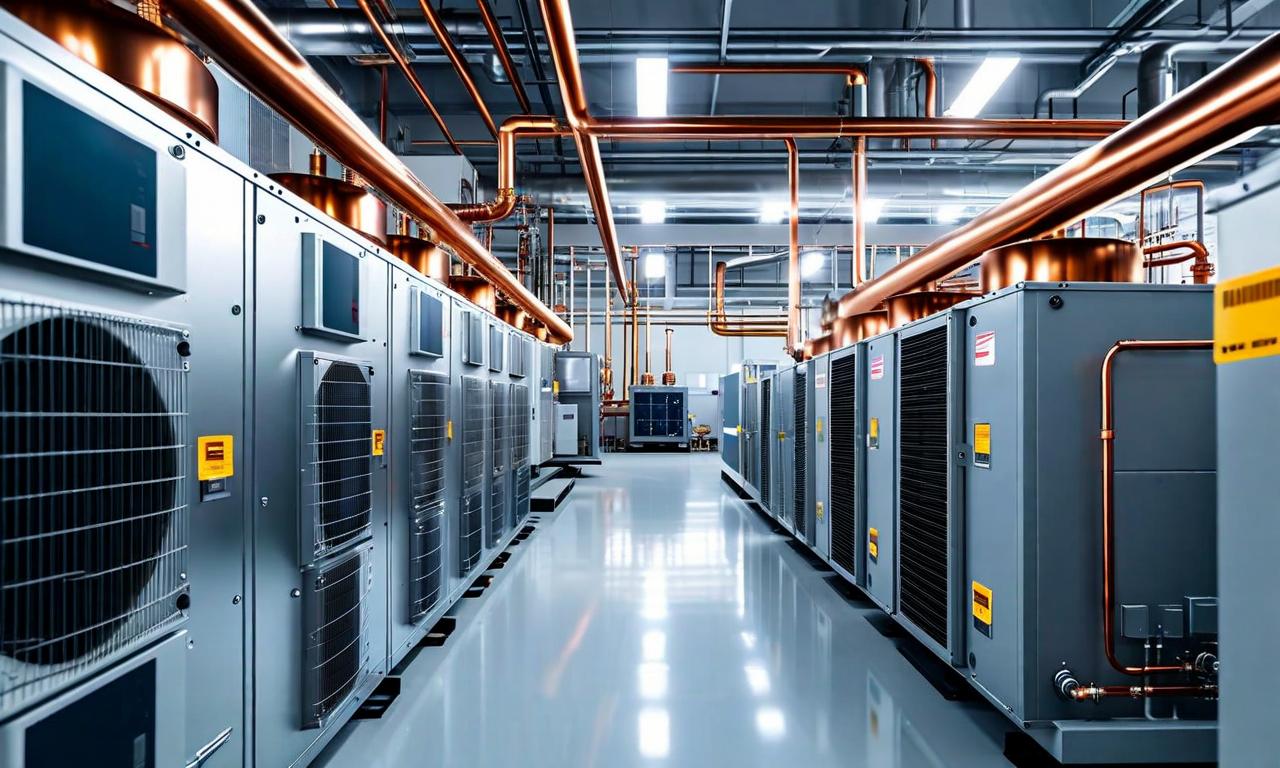
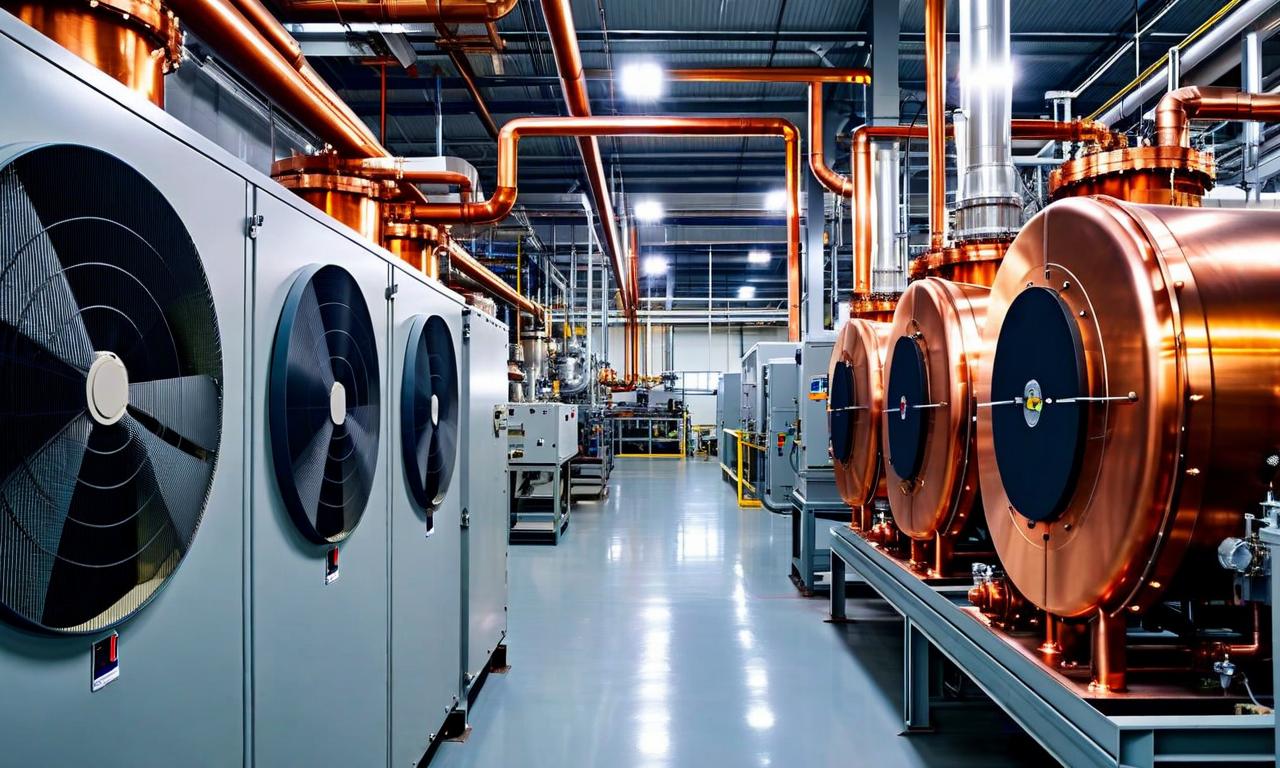
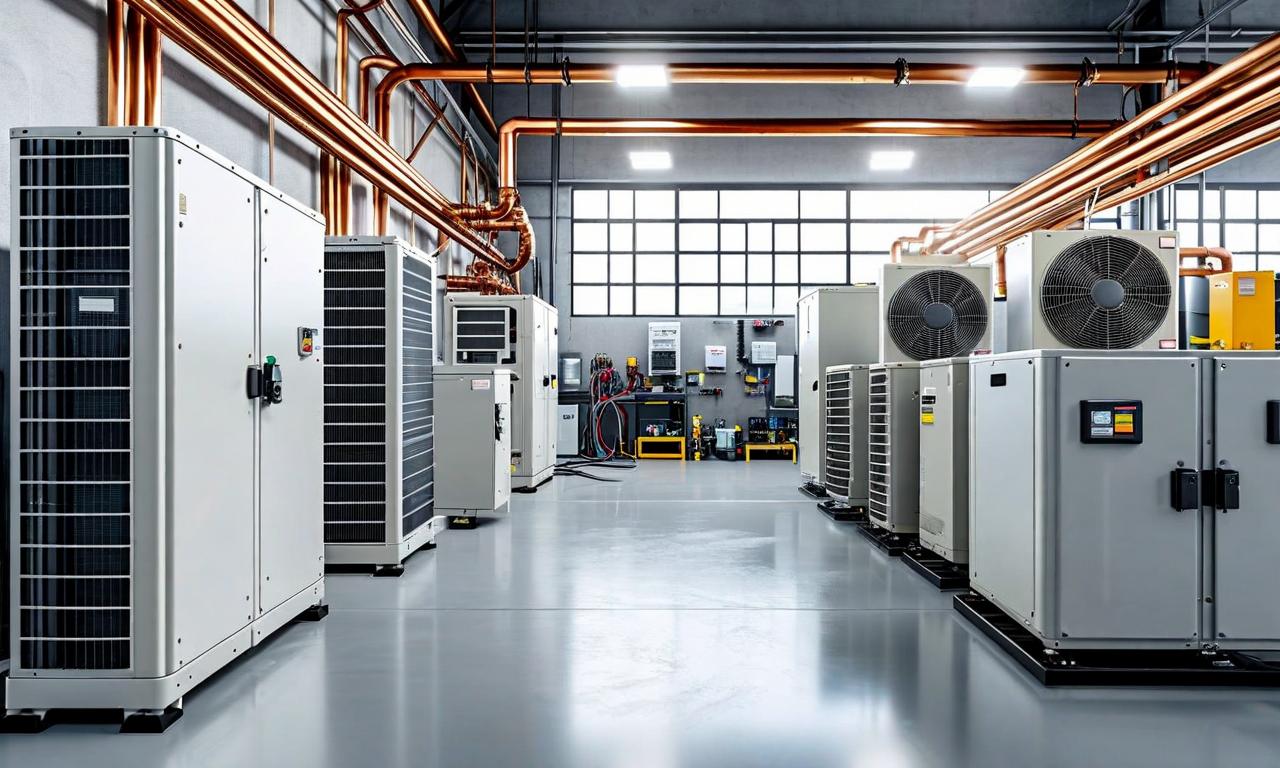
In the Electro-Mechanical Projects segment, commercial air conditioning gained momentum during Q4FY26, supported by healthy demand from government, industrial, and retail segments, while bookings from office, education, and IT sectors remained subdued. Revenue growth in ducted systems and chillers was good and VRF showed steady progress. On the international business front, the company's foray into the US is progressing well despite tariff-related uncertainties, and supplies to Europe have commenced. In the Unitary Products segment, the Room Air Conditioners business witnessed reasonable growth with primary demand picking up in March, and the company launched a wide range of new room ACs in compliance with new BEE norms. The market for deep freezers and cold rooms remained stagnant due to muted demand from frozen food and QSR segments; however, storage water coolers witnessed double-digit growth driven by strong demand from government and corporate sectors. In the Professional Electronics and Industrial Systems segment, Industrial Solutions continued to grow driven by strong demand in the automotive and steel industries, while Data Security Solutions maintained steady performance driven by demand from BFSI and large enterprises. The regulatory policy framework for the Med-Tech Solutions business remains unclear, consequently slowing that business.
| Business Segment: |
Development |
| Buildings, Data Centers, Factories |
Significant Growth in Inquiries |
| Overall Bookings (Q4FY26) |
Increased by 35.7% |
| Storage Water Coolers |
Double-digit growth |
| US Expansion |
Progressing well despite tariff uncertainties |
| Europe Supplies |
Commenced |
| Med-Tech Solutions |
Slowed due to unclear regulatory framework |
AC Price Increase: Progress and Outlook
Blue Star has so far implemented approximately 8% of the planned 13% price hike for its air conditioner range. The remaining approximately 5% is expected to be reflected in May-June billings. Management noted that the impact of the price increase may vary depending on the specific model, indicating a differentiated pricing approach across its product portfolio. Management reaffirmed its strategy of passing through current cost increases via pricing, though it cautioned that further cost inflation remains possible if the war situation continues.
| Price Increase Parameter: |
Details |
| Total Targeted Price Increase |
13% |
| Achieved So Far |
~8% |
| Remaining Increase |
~5% |
| Expected Billing Period |
May-June |
| Effect Variation |
May differ by model |
Dealer Stocking and Marketing Cost Overhang
The earnings call revealed that dealers stocked heavily in Q4FY25 in anticipation of a robust summer season and amid fears of compressor supply shortages. When summer demand turned out to be weaker than expected, the pre-positioned inventory could not be liquidated at the anticipated pace. Compounding this, Blue Star incurred significant advertising and IPL marketing expenditures that could not be recovered given the subdued demand environment. The company has since undertaken cost-cutting measures in response to the unfavourable summer season, with these measures extended through year-end. Management noted that inventory management is expected to be far better in the current year, with production being moderated in line with actual secondary demand.
| Factor: |
Impact |
| Heavy Dealer Stocking in Q4FY25 |
Excess inventory due to unmet summer demand |
| Compressor Shortage Concerns |
Prompted pre-emptive stocking by dealers |
| Weak Summer Demand |
High unrecoverable advertising and IPL marketing costs |
| Cost-Cutting Measures |
Implemented and extended through year-end |
Margin Outlook and Geopolitical Risks
Blue Star has warned that its current operating margin levels of 8–8.5% are unlikely to be sustained, with management predicting continued pressure through 2030. The company attributes this outlook to intensifying market competition and ongoing capacity additions in the industry. Poor margin visibility has been further attributed to unstable commodity prices—particularly copper and electronic components—as well as volatile exchange rates. The potential for electronics shortages arising from helium supply disruptions adds a further layer of uncertainty to the cost outlook. Beyond domestic demand challenges, Blue Star has flagged the ongoing Middle East crisis as an additional risk, warning that the conflict could disrupt supply chains and potentially slow business growth, with additional cost inflation possible if the war persists.
| Margin Pressure Factor: |
Details |
| Current Margin Levels |
8–8.5% |
| Margin Pressure Horizon |
Until 2030 |
| Growing Competition |
Pressure on Operating Margins |
| Capacity Additions |
Pressure on Operating Margins |
| Copper Costs |
Key Determinant of Profitability |
| Electronic Component Costs |
Key Determinant of Profitability |
| Helium Supply Problems |
Possible Electronics Shortages |
| Unstable Exchange Rates |
Margin Management Challenges |
| Middle East Crisis |
Supply Chain Disruption, Slower Growth, Additional Cost Inflation |
Growth Outlook and Key Management Commentary
Blue Star stated that it maintains an 8–10% growth outlook while remaining cautiously optimistic about its FY27 prospects. Management highlighted that the data center MEP market, currently estimated at ₹3,500 crores, could more than double within three years, with Blue Star's annual revenue from this segment at approximately ₹1,000 crores and order book at approximately ₹1,500 crores. Annual capex is guided in the range of ₹250 crores to ₹350 crores, encompassing routine, maintenance, R&D, product development, and IT investments. On the RAC industry, management estimated FY26 industry volumes at approximately 14.50 million to 14.75 million units, with Blue Star holding approximately 11% market share in volume terms and 14.25% in value terms. The company's manufacturing facilities are operating close to 100% capacity, with a decision on further capacity expansion expected in October. Management confirmed there are no plans to enter white goods categories such as washing machines or refrigerators, with the company remaining focused on air conditioning and refrigeration.
| Growth Parameter: |
Details |
| FY27 Growth Outlook |
8–10% |
| Data Center MEP Market Size |
~₹3,500 cr |
| Blue Star Data Center MEP Revenue |
~₹1,000 cr annually |
| Blue Star Data Center MEP Order Book |
~₹1,500 cr |
| Annual Capex Guidance |
₹250 cr – ₹350 cr |
| RAC Industry Volume (FY26 est.) |
~14.50 mn – 14.75 mn units |
| Blue Star RAC Market Share (Volume) |
~11% |
| Blue Star RAC Market Share (Value) |
~14.25% |


 19
19