

BirlaNu Q1FY27 net profit turns positive as EBITDA rises 35%


BirlaNu delivered a strong Q1FY27 performance with a consolidated net profit of ₹94M, reversing a net loss of ₹13M in Q1FY26. Consolidated revenue rose 11.6% YoY to ₹1,174 Cr, while EBITDA increased 35% to ₹80 Cr. The Roofs segment led growth with ₹517 Cr revenue, up 17%, and the Walls segment saw 14% revenue growth. Standalone net profit was ₹50 Cr. The company approved a ₹167 Cr investment for a new board plant near Hyderabad.


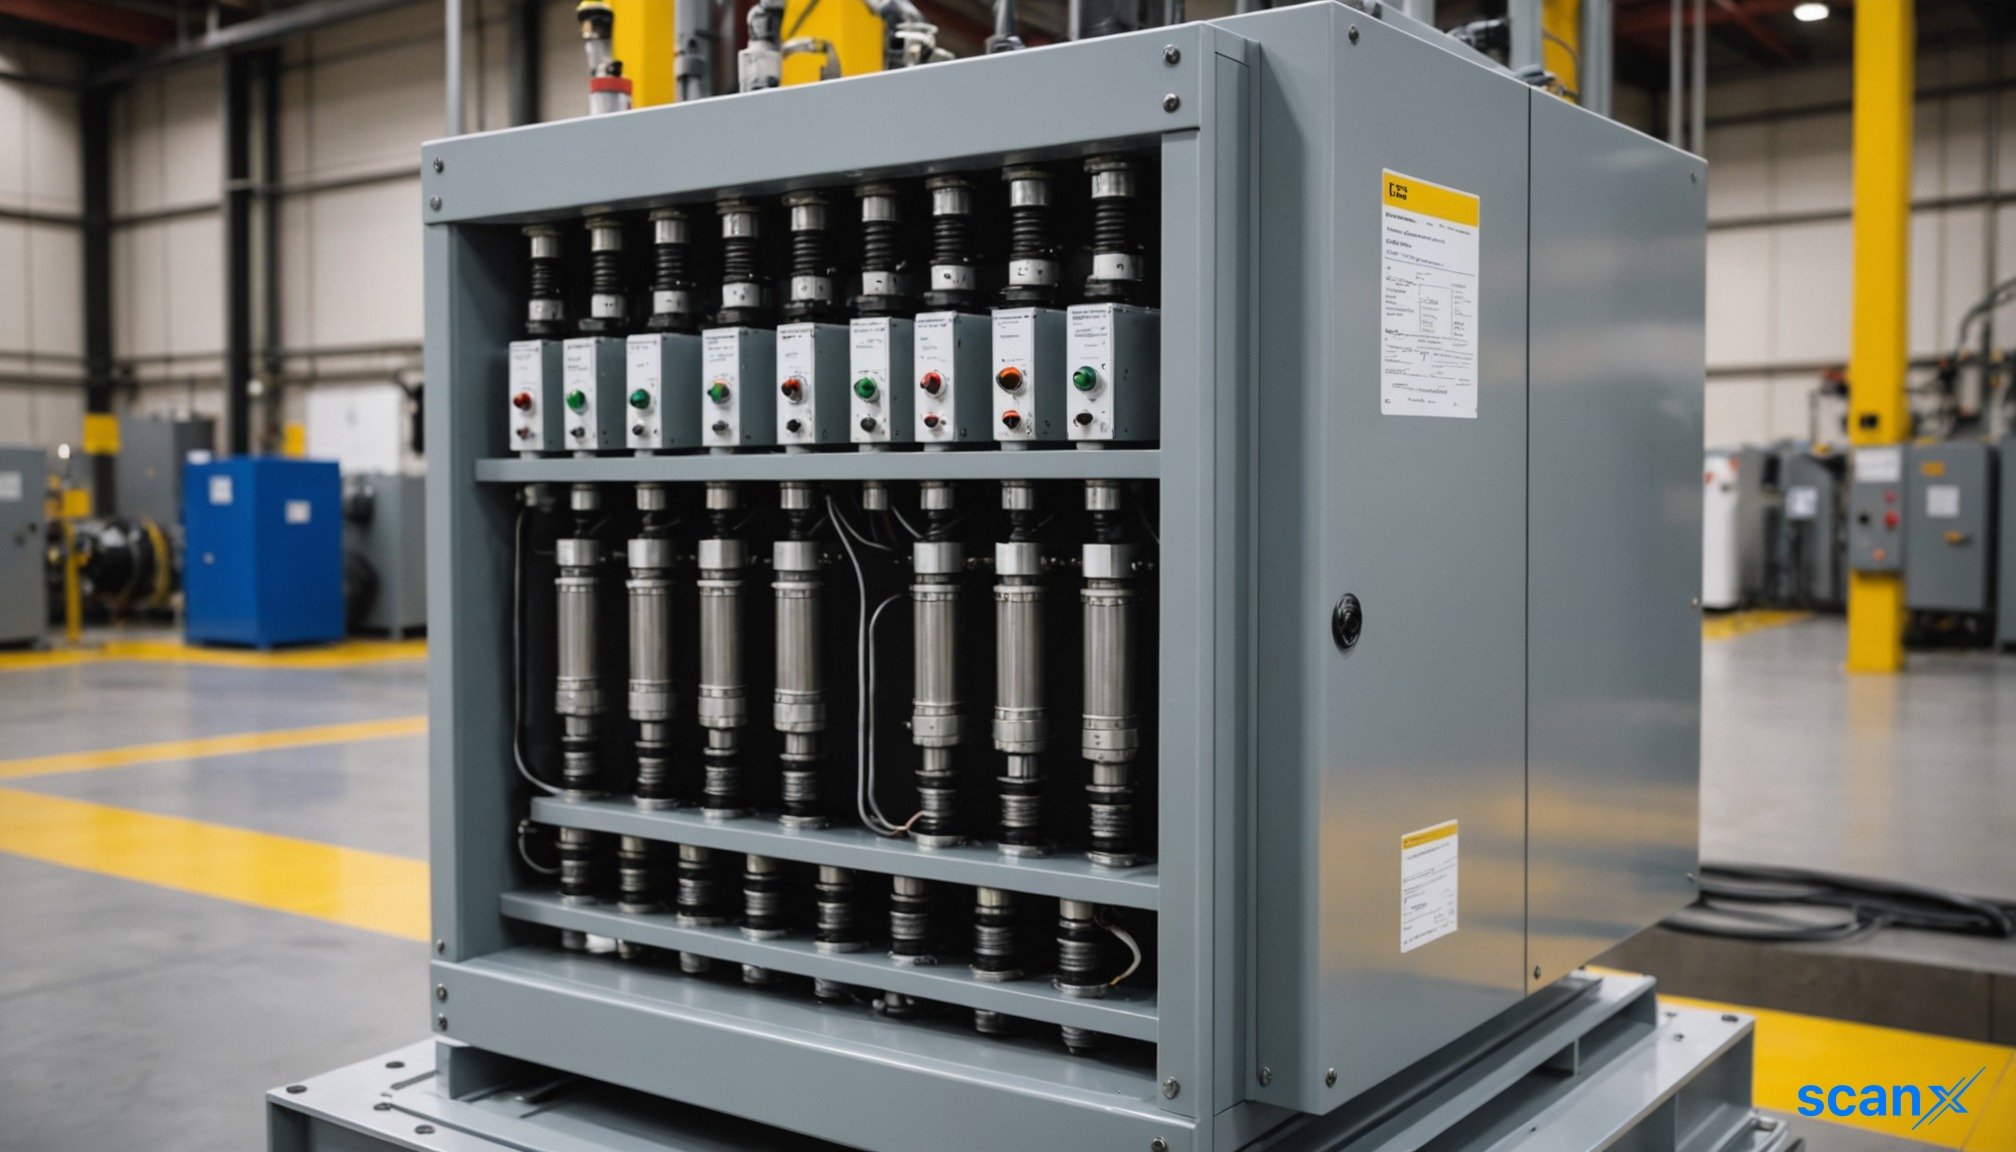
*this image is generated using AI for illustrative purposes only.
BirlaNu reported a consolidated net profit of ₹94M for Q1FY27, marking a significant turnaround from a net loss of ₹13M in the corresponding quarter of the previous year. The improvement was driven by an 11.6% year-on-year rise in revenue from operations to ₹1,174 crore and a 35% increase in EBITDA to ₹80 crore. This performance reflects robust domestic demand, particularly in the Roofs and Pipes segments, alongside effective cost management strategies implemented by management.
The Board of Directors, meeting on August 6, 2026, approved the unaudited standalone and consolidated financial results for the quarter ended June 30, 2026. Statutory Auditors B S R and Co issued limited review reports on the results. The disclosure was made pursuant to Regulation 30 and Regulation 33 of the SEBI (Listing Obligations and Disclosure Requirements) Regulations, 2015. Standalone net profit stood at ₹50 crore, up from ₹20 crore in Q1FY26.
Key Financial Highlights
Consolidated revenue from operations reached ₹1,174 crore, compared to ₹1,052 crore in Q1FY26. Total income was ₹1,181 crore, while total expenses amounted to ₹1,156 crore. Profit before tax improved to ₹25 crore from ₹5 crore in the prior year period. Tax expense was ₹16 crore, comprising current tax of ₹34 crore and a deferred tax benefit of ₹18 crore.
| Metric: | Q1FY27 | Q1FY26 | Change (YoY) |
|---|---|---|---|
| Revenue from Operations: | ₹1,174 Cr | ₹1,052 Cr | +11.6% |
| EBITDA: | ₹80 Cr | ₹59 Cr* | +35% |
| Net Profit / (Loss): | ₹94M | (₹13M) | Turnaround |
*Note: Previous reporting cited ₹397M EBITDA for Q1FY26; investor presentation clarifies consolidated EBITDA growth at 35% to ₹80 Cr. Standalone EBITDA surged 71% to ₹98 crore.
Segment Performance
The Roofs segment emerged as the primary growth driver, crossing the record ₹500 crore mark with quarterly revenue of ₹517 crore, up 17% YoY. It contributed ₹90 crore to pre-tax profits, rising from ₹59 crore in Q1FY25. The Walls segment also showed strength, with revenue growing 14% to ₹156 crore, driven by volume momentum in Panels and Blocks. Pre-tax profits for Walls rose to ₹85 crore from ₹30 crore.
Conversely, the Floors segment faced headwinds, reporting a pre-tax loss of ₹37 crore, widening from a loss of ₹18 crore in Q1FY25, despite revenue increasing 12% to ₹341 crore. The Pipes & Construction Chemicals segment posted a pre-tax loss of ₹5 crore on revenue of ₹159 crore.
| Segment: | Revenue (₹ Cr) | Pre-Tax Profit/Loss (₹ Cr) |
|---|---|---|
| Roofs: | 517 | 90 |
| Walls: | 156 | 85 |
| Pipes & Construction Chemicals: | 159 | (5) |
| Floors: | 341 | (37) |
| Others: | 2 | 1 |
Strategic Initiatives and Outlook
Management highlighted a focus on operational efficiency and brand salience amidst geopolitical volatility. The Board approved a new Fibre Cement Board plant near Hyderabad, adding 72,000 MT per annum capacity with an investment of ₹167 crore. This complements the upcoming greenfield plant in Nellore. Additionally, BirlaNu’s subsidiary Parador sustained revenues at par with last year despite European demand slumps, with its order book up 10% YoY, signaling potential recovery in H2FY27.
What the Numbers Show
The shift to profitability is underpinned by margin expansion in high-velocity domestic segments like Roofs and Pipes, which saw operating margins expand by 390 bps and 660 bps respectively. While the Floors segment continues to drag on overall profitability, the strong performance in Roofs and Walls demonstrates the effectiveness of BirlaNu’s product innovation and market penetration strategies. The approval of new capacity indicates confidence in long-term demand for building materials.
Historical Stock Returns for Birlanu
| 1 Day | 5 Days | 1 Month | 6 Months | 1 Year | 5 Years |
|---|---|---|---|---|---|
| +0.37% | -6.57% | -9.27% | -7.64% | -30.91% | -74.54% |

How will the ₹167 crore investment in the new Hyderabad Fibre Cement Board plant impact BirlaNu's return on capital employed (ROCE) in the medium term?
What specific operational strategies is management implementing to reverse the widening pre-tax losses in the Floors segment?
To what extent will the 10% year-on-year growth in Parador's order book offset the current demand slump in European markets for H2FY27?
 18
18






 Create Custom Screeners
  Access 200+ Pre-built Filters
  Use 50+ Readymade Screener





