

Belding India Q1 Results: Net profit rises 22% YoY to ₹192.7 crore


Belding India Limited delivered strong Q1FY27 results with net profit surging 22.4% YoY to ₹192.7 crore, supported by a 17.5% revenue increase to ₹417.8 crore. The debt equity ratio improved to 1.26, signaling better financial health. EPS rose to ₹3.85 from ₹3.10 in the prior year quarter.


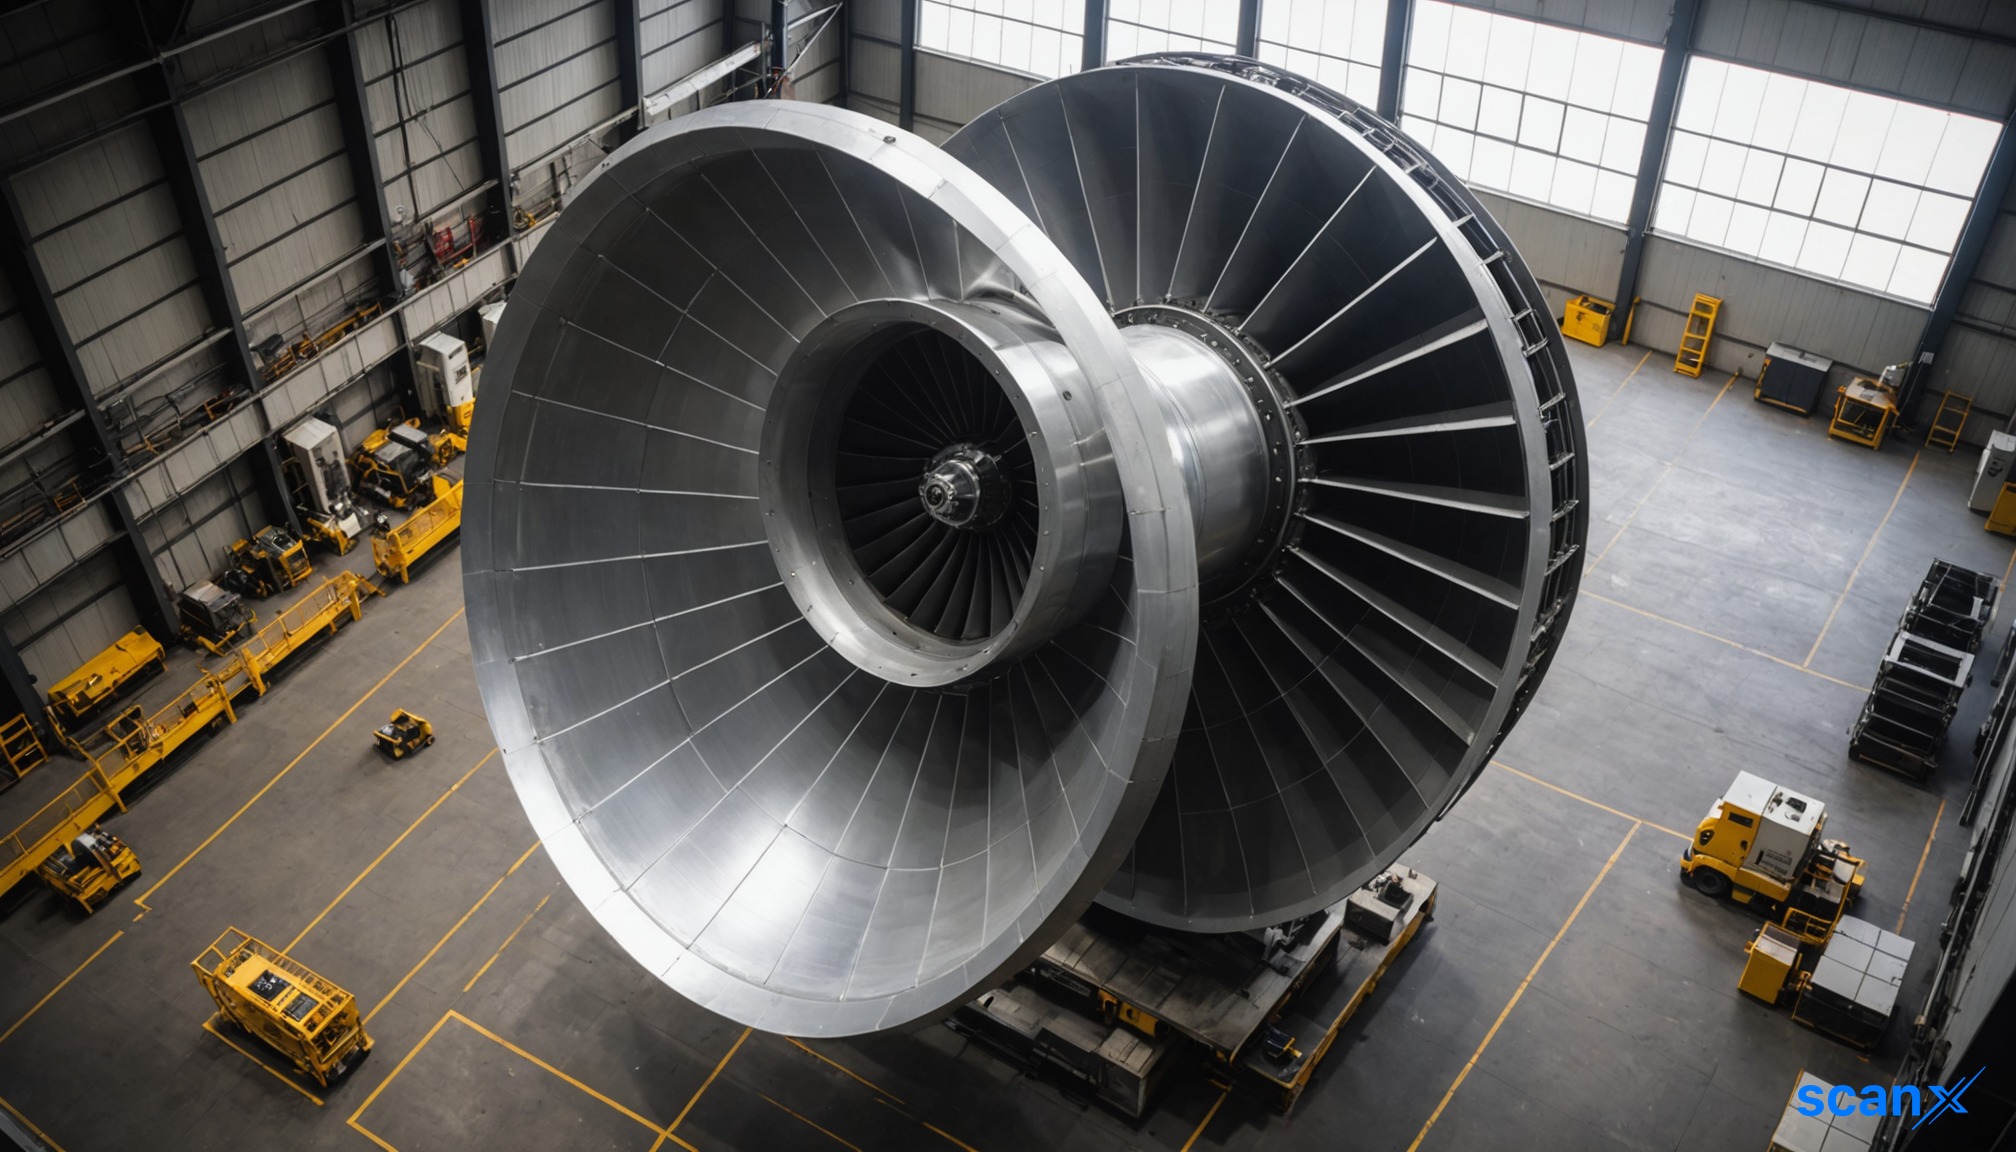
*this image is generated using AI for illustrative purposes only.
Belding India Limited reported a robust start to FY27, with standalone net profit after tax rising 22.4% year-on-year to ₹192.7 crore (₹19,272.28 lakh) for the quarter ended June 30, 2026. This compares to a net profit of ₹154.7 crore (₹15,472.73 lakh) in Q1FY26. The profit growth was underpinned by a 17.5% increase in total income from operations, which stood at ₹417.8 crore (₹41,784.01 lakh) against ₹355.7 crore (₹35,566.90 lakh) in the same period last fiscal. The results highlight sustained operational efficiency and top-line expansion for the packaging and paper products manufacturer.
The Board of Directors approved the unaudited financial results on July 31, 2026. The figures were subjected to limited review by the statutory auditors and filed with the stock exchanges under Regulation 33 and Regulation 52 of the SEBI (Listing Obligations and Disclosure Requirements) Regulations, 2015. The financial statements were prepared in accordance with Ind AS notified under the Companies (Indian Accounting Standards) Rules, 2015.
Financial Performance Highlights
The company demonstrated significant growth in key financial metrics during the quarter. Earnings per share (basic) increased to ₹3.85 from ₹3.10 in Q1FY26. The net worth of the company rose to ₹4,343.6 crore (₹434,362.37 lakh), up from ₹3,814.2 crore (₹381,418.57 lakh) in the previous year’s corresponding quarter.
| Metric | Q1FY27 (₹ in lakhs) | Q1FY26 (₹ in lakhs) | Change |
|---|---|---|---|
| Total Income from Operations | 41,784.01 | 35,566.90 | +17.5% |
| Net Profit Before Tax | 24,294.85 | 19,842.54 | +22.4% |
| Net Profit After Tax | 19,272.28 | 15,472.73 | +22.4% |
| Basic EPS (₹) | 3.85 | 3.10 | +24.2% |
Balance Sheet and Capital Structure
Belding India maintained a stable capital structure with a slight improvement in leverage ratios. The debt equity ratio declined to 1.26 in Q1FY27 from 1.31 in Q1FY26, indicating a healthier balance sheet position. Outstanding paid-up debt capital increased to ₹5,455.2 crore (₹545,517.81 lakh) from ₹4,979.6 crore (₹497,962.01 lakh) in Q1FY26, likely due to ongoing capacity expansion or working capital requirements. Reserves excluding revaluation reserve grew to ₹4,243.5 crore (₹424,346.52 lakh), up from ₹3,714.2 crore (₹371,420.40 lakh) a year ago.
What the Numbers Show
The divergence between revenue growth (17.5%) and net profit growth (22.4%) suggests improved operational margins or favorable one-off items contributing to the bottom line. With no exceptional or extraordinary items reported in either period, the profit acceleration appears driven by core operational efficiencies. The reduction in the debt equity ratio despite an increase in absolute debt levels points to a stronger equity base, potentially from retained earnings accumulation, enhancing the company’s financial resilience.
Comparative data for the full year ended March 31, 2026, shows total income of ₹1,484.8 crore (₹148,476.99 lakh) and net profit after tax of ₹692.9 crore (₹69,287.05 lakh). The quarterly results align with the annual trajectory, reinforcing consistent performance across periods.
Historical Stock Returns for Belding
| 1 Day | 5 Days | 1 Month | 6 Months | 1 Year | 5 Years |
|---|---|---|---|---|---|
| +2.14% | +4.26% | +4.26% | +4.26% | +4.26% | +4.26% |

How will the ongoing capacity expansion, indicated by the rise in debt capital, impact Belding India's future revenue growth and market share in the packaging sector?
Given the divergence between revenue and profit growth, can Belding India sustain these improved operational margins amid rising raw material costs in the paper industry?
What is the expected timeline for the new capacity additions to become fully operational, and how will this affect the company's leverage ratios in subsequent quarters?
 15
15






 Access Market Heat-map & Insights
  Create, Save & Share your Screener
  Use 200+ Screening Filters





