Avalon Technologies Q1 Results: Net Profit Jumps 145% YoY, EBITDA Margin Expands

2 min read     Updated on 05 Aug 2026, 01:06 AM
scanx
Reviewed by
Ashish TScanX News Team
AI Summary

Avalon Technologies reported a strong Q1FY26 performance with consolidated net profit surging 145% YoY to ₹348.69 million and revenue rising 50% to ₹4,844.14 million. EBITDA improved significantly to ₹580 million from ₹299 million, with EBITDA margin expanding to 11.96% from 9.24% year-on-year, reflecting enhanced operational leverage and core business strength.

powered bylight_fuzz_icon
47416352

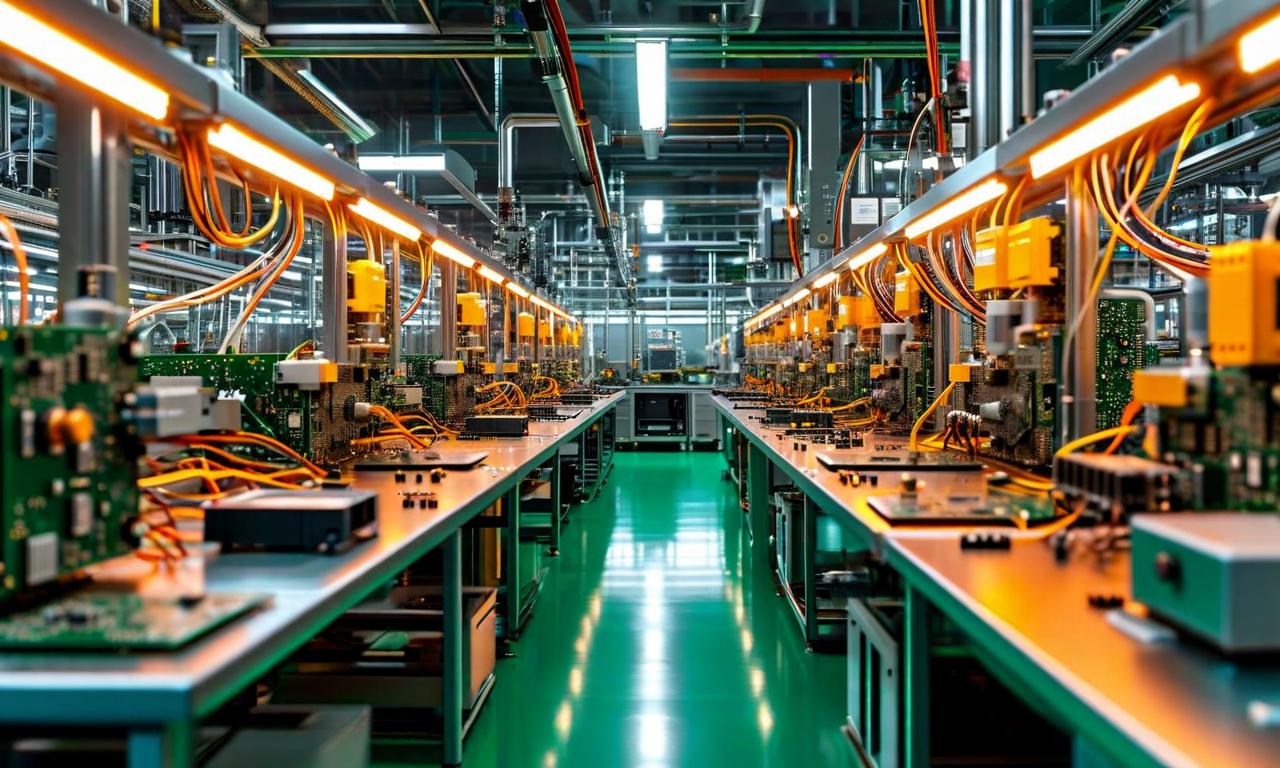
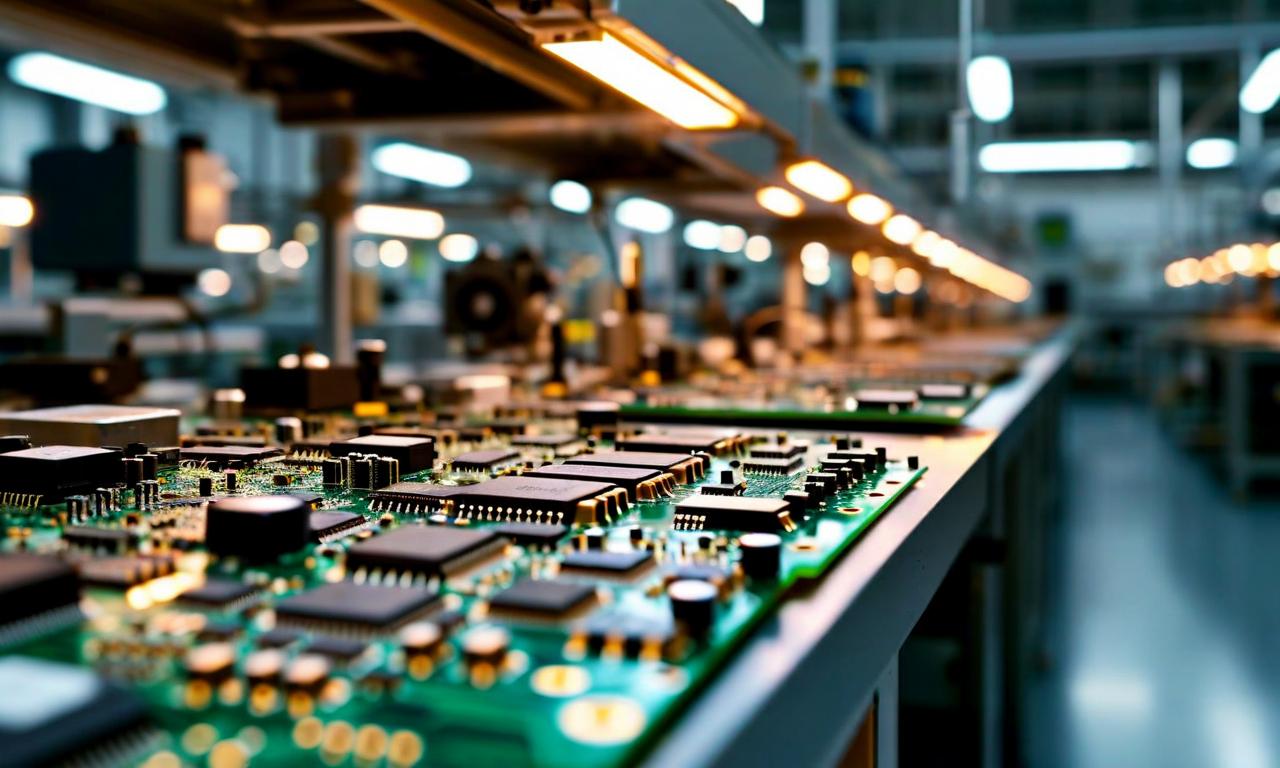
*this image is generated using AI for illustrative purposes only.

Avalon Technologies Limited reported a consolidated net profit of ₹348.69 million for the quarter ended June 30, 2026, a 145% increase from ₹142.14 million in Q1FY25. The Chennai-based Electronics Manufacturing Services (EMS) provider saw consolidated revenue from operations surge 50% to ₹4,844.14 million, compared to ₹3,233.08 million in the prior-year period, reflecting robust order execution across its global footprint. EBITDA for the quarter stood at ₹580 million, up from ₹299 million in Q1FY25, with EBITDA margin expanding to 11.96% from 9.24% year-on-year.

The results were reviewed and recommended by the Audit Committee and approved by the Board of Directors at meetings held on August 4, 2026. The unaudited standalone and consolidated financial statements were prepared in accordance with Indian Accounting Standards (Ind AS) and Regulation 33 of the SEBI (Listing Obligations and Disclosure Requirements) Regulations, 2015. Varma & Varma, the statutory auditors, issued a limited review report stating that nothing came to their attention to suggest material misstatement.

Financial Performance

Standalone net profit stood at ₹201.49 million, up 38% year-on-year from ₹145.77 million. Standalone revenue from operations grew 27% to ₹2,106.40 million. The company's basic earnings per share (EPS) rose to ₹5.22 on a consolidated basis, compared to ₹2.14 in Q1FY25. Diluted EPS was ₹5.20, versus ₹2.12 in the corresponding quarter of the previous fiscal year.

Metric Consolidated Q1FY26 Consolidated Q1FY25 Change Standalone Q1FY26 Standalone Q1FY25 Change
Revenue from Operations (₹ Mn) 4,844.14 3,233.08 +50% 2,106.40 1,664.94 +27%
EBITDA (₹ Mn) 580.00 299.00 +94%
EBITDA Margin (%) 11.96 9.24 +272 bps
Profit Before Tax (₹ Mn) 487.39 193.07 +152% 266.28 192.96 +38%
Net Profit (₹ Mn) 348.69 142.14 +145% 201.49 145.77 +38%
Basic EPS (₹) 5.22 2.14 +144% 3.02 2.19 +38%

Total comprehensive income for the group reached ₹336.15 million, compared to ₹141.72 million in Q1FY25. Other income contributed ₹28.17 million to total income, down significantly from ₹119.20 million in the preceding quarter but higher than the ₹16.57 million recorded in Q1FY25.

Operational Highlights

The Group operates in a single reportable business segment providing EMS capabilities, including printed circuit board assembly and custom cable and wire harnesses. The consolidated entity includes Avalon Technology and Services Private Limited, Sienna Ecad Technologies Private Limited, and ABV Electronics, Inc. (d/b/a Sienna Corporation) in the United States. During the quarter, the company allotted 45,592 equity shares upon exercise of employee stock options. As of June 30, 2026, 3,29,083 employee stock options remained outstanding from a total grant of 20,03,321.

What the Numbers Show

The disproportionate rise in consolidated net profit relative to revenue growth highlights improved operating leverage. While consolidated revenue grew 50%, profit before tax surged 152%, and EBITDA margin expanded by approximately 272 basis points year-on-year to 11.96%. This divergence suggests that fixed costs were absorbed more efficiently against higher sales volumes, or that mix shifts favored higher-margin products. Employee benefit expenses rose 32% to ₹834.13 million, lagging revenue growth, which further supports margin expansion. Other income declined sharply quarter-on-quarter, indicating that the current period's profitability is driven primarily by core operational performance rather than non-operating gains.

Historical Stock Returns for Avalon Technologies

1 Day5 Days1 Month6 Months1 Year5 Years
+3.06%+4.47%+0.96%+76.53%+106.56%+353.62%

Can Avalon Technologies sustain the 11.96% EBITDA margin expansion in subsequent quarters as it scales its global EMS operations?

How will the company's robust order execution in Q1FY26 translate into full-year revenue guidance and market share growth in the competitive EMS sector?

What specific product mix shifts or cost absorption strategies drove the disproportionate rise in net profit compared to revenue growth?

Avalon Technologies net profit jumps 145% in Q1FY27 on margin expansion

3 min read     Updated on 05 Aug 2026, 12:42 AM
scanx
Reviewed by
Naman SScanX News Team
AI Summary

Avalon Technologies Ltd reported a consolidated net profit of ₹348.69 million for Q1FY27, a 145% increase from the previous year, alongside a 50% rise in revenue to ₹4,844.14 million. The company demonstrated strong operational leverage with EBITDA margin expanding to 12.0%. Key drivers included robust global demand, particularly from the US subsidiary, and improved working capital efficiency with NWC days reducing to 117. The Board approved the results on August 04, 2026, citing successful execution of expansion strategies and new certifications.

powered bylight_fuzz_icon
47416158

*this image is generated using AI for illustrative purposes only.

Avalon Technologies reported a consolidated net profit of ₹348.69 million for the quarter ended June 30, 2026, marking a 145% year-on-year increase from ₹142.14 million in Q1FY26. The electronics manufacturing services (EMS) provider saw consolidated revenue from operations rise 50% to ₹4,844.14 million, driven by strong demand across its global operations and effective execution of its expansion strategy. This performance underscores the company’s ability to leverage operating scale, as evidenced by an EBITDA margin expansion of 272 basis points to 12.0%, signaling robust profitability amidst rising sales volumes.

The Board of Directors approved the unaudited standalone and consolidated financial results at a meeting held on August 04, 2026, in compliance with Regulation 30 and Regulation 33 of the SEBI (Listing Obligations and Disclosure Requirements) Regulations, 2015. Statutory Auditors Varma & Varma issued a limited review report on the financial statements, confirming they present a true and fair view in accordance with Ind AS 34. The company also released an investor presentation detailing its business highlights, strategy, and financial metrics for the quarter.

Consolidated Financial Performance

Consolidated total income reached ₹4,872.31 million, up from ₹3,249.65 million in Q1FY26. Total expenses stood at ₹4,384.92 million, an increase from ₹3,056.58 million in the corresponding quarter of the previous year. Profit before tax improved to ₹487.39 million from ₹193.07 million, while total tax expense was ₹138.70 million. EBITDA rose sharply by 94% to ₹580 million. On a standalone basis, the company reported a net profit of ₹201.49 million, up from ₹145.77 million in Q1FY26. Standalone revenue from operations was ₹2,106.40 million, compared to ₹1,664.94 million in the prior-year quarter.

Particulars Q1FY27 (₹ Mn) Q1FY26 (₹ Mn) YoY Change
Revenue from Operations 4,844.14 3,233.08 50%
Total Income 4,872.31 3,249.65 50%
EBITDA 580.00 299.00 94%
Profit Before Tax 487.39 193.07 153%
Net Profit 348.69 142.14 145%
Basic EPS (₹) 5.22 2.14 144%

What the Numbers Show

The significant divergence between the 50% revenue growth and the 145% net profit growth indicates operating leverage is benefiting the bottom line as fixed costs remain relatively stable against rising sales volumes. Employee benefit expenses rose to ₹834.13 million consolidated, up from ₹633.71 million, reflecting increased headcount or compensation adjustments aligned with production scaling. Finance costs decreased slightly to ₹34.59 million from ₹37.68 million, suggesting efficient debt management despite expansion activities. Gross margin stood at 34.7%, supporting the expanded operating margins. The company’s capex-light model allows for higher returns on invested capital, as evidenced by the improvement in Net Working Capital days from 142 days in June 2025 to 117 days in June 2026.

Operational Highlights and Subsidiary Contributions

The consolidated results include the performance of key subsidiaries: Avalon Technology and Services Private Limited, Sienna Ecad Technologies Private Limited, and ABV Electronics, Inc. (doing business as Sienna Corporation) in the United States. The US subsidiary reported total income of ₹2,392.03 million and net profit after tax of ₹64.02 million for the quarter, contributing significantly to the group’s overall profitability. Its financial statements were prepared under US GAAP and restated to comply with Ind AS for consolidation purposes. Operationally, India manufacturing delivered a 16.7% EBITDA margin and 11.1% PAT margin in Q1FY27. The company highlighted that its order book increased by 23.4% year-on-year. Additionally, the brownfield expansion for domestic demand in Chennai is now operational, and the company secured EN 15085-2 certification, strengthening its capabilities in railway welding applications.

Share Capital and ESOPs

Paid-up equity share capital remained at ₹133.62 million. During the quarter, the company allotted 45,592 equity shares upon exercise of employee stock options by eligible employees. As of June 30, 2026, 3,29,083 employee stock options remained outstanding out of 20,03,321 granted historically.

Historical Stock Returns for Avalon Technologies

1 Day5 Days1 Month6 Months1 Year5 Years
+3.06%+4.47%+0.96%+76.53%+106.56%+353.62%

Can Avalon Technologies sustain the 272 basis point EBITDA margin expansion in subsequent quarters as it scales further, or will rising input costs erode these gains?

How will the newly operational brownfield expansion in Chennai impact the company's capacity utilization and order fulfillment timelines for domestic railway clients?

What is the strategic roadmap for integrating Sienna Corporation's US operations to drive higher profitability beyond the current ₹64.02 million quarterly contribution?

More News on Avalon Technologies

1 Year Returns:+106.56%