Apple launches Klarna-backed leasing program to offset rising hardware costs

scanx
Reviewed by
Naman SScanX News Team
Key Highlights
  • Apple partners with Klarna for new device leasing program covering iPhone, Mac, iPad, and Watch
  • Strategy aims to protect device volumes and encourage premium configurations amid rising hardware costs
  • Klarna handles financing, keeping credit risk and receivables off Apple's balance sheet
  • Analyst targets diverge widely, with Rothschild & Co at $400.00 vs Jefferies at $263.66
powered bylight_fuzz_icon
49460009

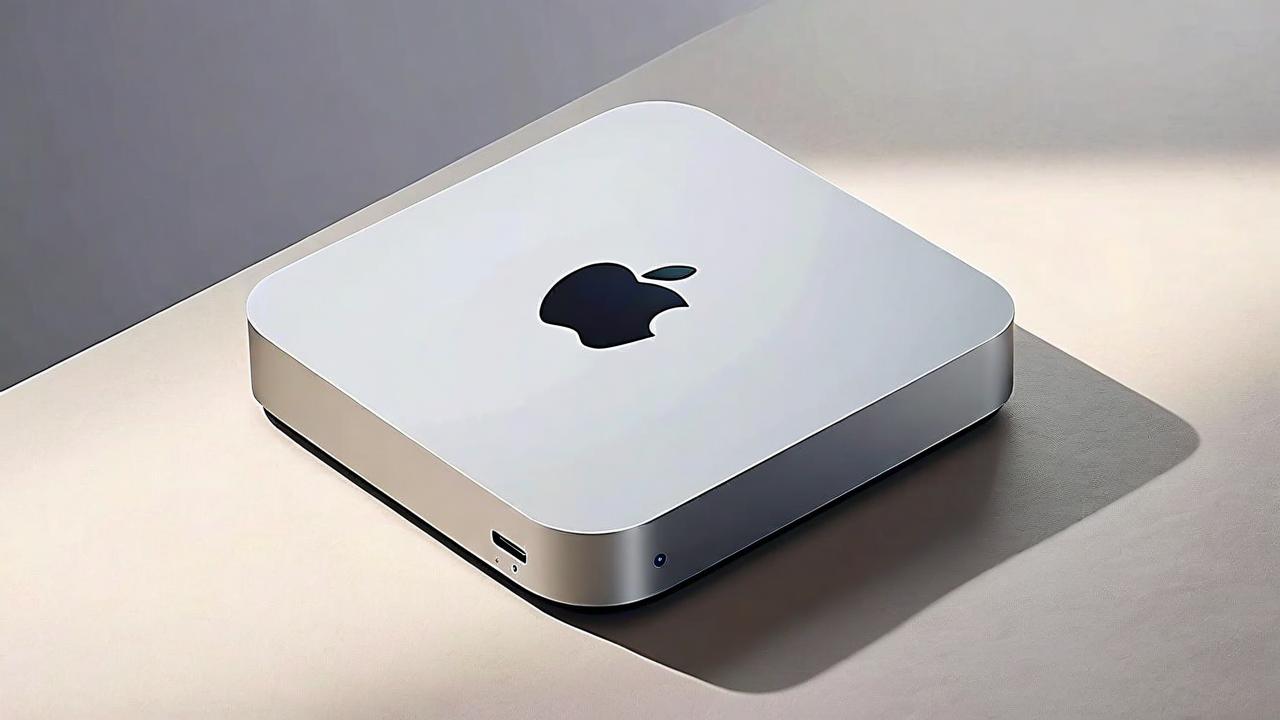
*this image is generated using AI for illustrative purposes only.

Apple Inc (NASDAQ: AAPL) shares rose 0.24% to $315.33 in premarket trading as investors reacted to the company's shift toward a leasing-based financing model. The move aims to maintain device volumes amid rising hardware costs.

Leasing Strategy And Market Context

The company is partnering with Klarna Group plc (NYSE: KLAR) to power a new device leasing program. Counterpoint Research analyst Maurice Klaehne noted that higher hardware costs and potential price increases are driving this focus on monthly affordability. The program covers iPhone, Apple Watch, Mac, and iPad devices. Customers can upgrade, buy their existing device or return it when the lease ends.

Klaehne stated that the Apple Upgrade program could protect device volumes as prices rise while encouraging customers to choose higher-priced configurations. He also highlighted the strategy's potential to attract first-time iOS users and Android switchers, potentially shortening replacement cycles.

Balance Sheet Implications

A key advantage of the partnership is risk allocation. Klaehne pointed out that Klarna handles the financing relationship. This allows Apple to benefit from customer loyalty and device sales without carrying receivables or credit risk on its balance sheet.

The timing aligns with memory shortages driving DRAM and NAND prices higher. Apple has raised prices across parts of its product lineup in response. Klaehne views the upcoming iPhone 18 cycle as a critical test of whether leasing can offset higher upfront prices and sustain demand.

Lower carrier device promotions may also encourage consumers to consider Apple Upgrade as an alternative payment option.

Analyst Consensus And ETF Exposure

Apple stock carries a Buy rating with an average price forecast of $335.24. Recent analyst actions show divergent views:

Firm Action Rating Forecast Date
Rothschild & Co Upgrade Buy $400.00 Aug. 17
Jefferies Downgrade Underperform $263.66 Aug. 10
China Renaissance Downgrade Hold $280.00 Aug. 4

Apple holds significant weight in major ETFs, including the iShares S&P 100 ETF (9.83%), HCM Defender 100 Index ETF (9.81%), and NYLI US Large Cap R&D Leaders ETF (9.49%). Significant inflows or outflows from these funds will likely force automatic buying or selling of the stock.

What the Numbers Show

The divergence in analyst forecasts is notable. Rothschild & Co’s $400.00 target sits 35% above Jefferies’ $263.66 estimate. This wide spread reflects uncertainty over how effectively the new leasing model can counteract rising component costs and potential demand softness.

How might Apple's shift to a leasing model impact its long-term revenue recognition patterns and gross margins compared to traditional outright sales?

To what extent could the partnership with Klarna expose Apple to reputational risks if the fintech partner faces regulatory scrutiny or credit defaults?

Will the introduction of the Apple Upgrade program cannibalize existing carrier subsidy promotions, or will it primarily capture market share from Android users?

like19
dislike

Apple P/E 36.08 below peer avg 41.94; revenue growth lags

scanx
Reviewed by
Riya DScanX News Team
Key Highlights
  • Apple P/E of 36.08 is below industry average of 41.94
  • Revenue growth of 16.36% lags sector average of 49.02%
  • ROE of 27.84% outperforms industry average of 20.66%
  • EBITDA of $39.02 billion is 26.19x higher than peer average
  • Debt-to-equity ratio of 0.78 indicates strong balance sheet
powered bylight_fuzz_icon
49457135

*this image is generated using AI for illustrative purposes only.

Apple Inc (NASDAQ: AAPL) trades at a price-to-earnings ratio of 36.08, which is below the Technology Hardware, Storage & Peripherals industry average of 41.94. Despite this lower multiple, the company’s revenue growth of 16.36% significantly trails the sector average of 49.02%.

The divergence between Apple’s valuation multiples and its growth metrics highlights a distinct market positioning compared to peers such as SanDisk Corp and Seagate Technology Holdings PLC.

Valuation Metrics

Apple’s valuation profile presents a mixed picture relative to its competitors. The stock’s P/E ratio of 36.08 is 0.86x less than the industry average, suggesting potential value relative to earnings power. However, the Price-to-Book (P/B) ratio of 42.70 exceeds the industry average of 16.98 by 2.51x, indicating a premium valuation relative to book value.

Similarly, the Price-to-Sales (P/S) ratio of 9.96 is 1.78x higher than the industry average of 5.61, suggesting the market prices Apple’s sales at a significant premium compared to peers like Hewlett Packard Enterprise Co and Super Micro Computer Inc.

Profitability and Efficiency

Apple demonstrates superior profitability metrics across key indicators. The Return on Equity (ROE) stands at 27.84%, which is 7.18% above the industry average of 20.66%. This efficiency in generating profits from shareholder equity contrasts with peers like Diebold Nixdorf Inc, which reports an ROE of just 1.56%.

Earnings Before Interest, Taxes, Depreciation, and Amortization (EBITDA) for Apple totals $39.02 billion, which is 26.19x higher than the industry average of $1.49 billion. Gross profit reaches $54.77 billion, surpassing the industry average of $1.89 billion by 28.98x. These figures underscore Apple’s robust cash flow generation and core operational profitability.

Metric Apple Inc Industry Average Difference
P/E Ratio 36.08 41.94 -0.86x
P/B Ratio 42.70 16.98 +2.51x
P/S Ratio 9.96 5.61 +1.78x
ROE 27.84% 20.66% +7.18%
EBITDA ($B) 39.02 1.49 +26.19x
Gross Profit ($B) 54.77 1.89 +28.98x
Revenue Growth 16.36% 49.02% -32.66%

Growth Trajectory

While Apple leads in absolute profitability, its growth rate lags behind the broader sector. With revenue growth of 16.36%, Apple underperforms the industry average of 49.02%. This slowdown in sales expansion contrasts with high-growth peers such as SanDisk Corp (371.59%) and Western Digital Corp (43.84%).

Balance Sheet Health

Apple maintains a conservative capital structure with a debt-to-equity ratio of 0.78. This figure is lower than that of its top four peers, indicating a reliance on less debt financing and a favorable balance between debt and equity. This financial stability supports the company’s ability to manage risks amidst fluctuating market conditions.

What the Numbers Show

Apple’s financial data reveals a clear divergence between valuation multiples and growth metrics. While the P/E ratio suggests undervaluation relative to earnings, the elevated P/B and P/S ratios indicate the market assigns a premium to Apple’s brand and ecosystem strength. However, the significant gap between Apple’s 16.36% revenue growth and the industry’s 49.02% average highlights a maturation phase where scale and profitability outweigh rapid top-line expansion seen in smaller or cyclical peers.

How might Apple's slower revenue growth relative to the industry average impact investor sentiment regarding its long-term valuation premium?

Could Apple's high Price-to-Book ratio signal market confidence in its intangible assets, such as brand loyalty and ecosystem lock-in, despite lower growth rates?

What strategic initiatives is Apple pursuing to bridge the gap between its 16.36% revenue growth and the sector's 49.02% average?

like18
dislike

More News on Apple Inc