

AMD stock rises 3% in premarket on broader market strength


- AMD shares rose 3.05% to $576.89 in premarket trading, driven by broader market gains in Nasdaq and S&P 500 futures
- Stock trades at $576.90, which is 18.1% above its 20-day SMA and 63.5% above its 200-day SMA
- Analyst consensus is Buy with an average price target of $604, including recent upgrades from Raymond James and initiations from Piper Sandler
- P/E ratio stands at 142.8, indicating premium valuation despite strong momentum and growth scores



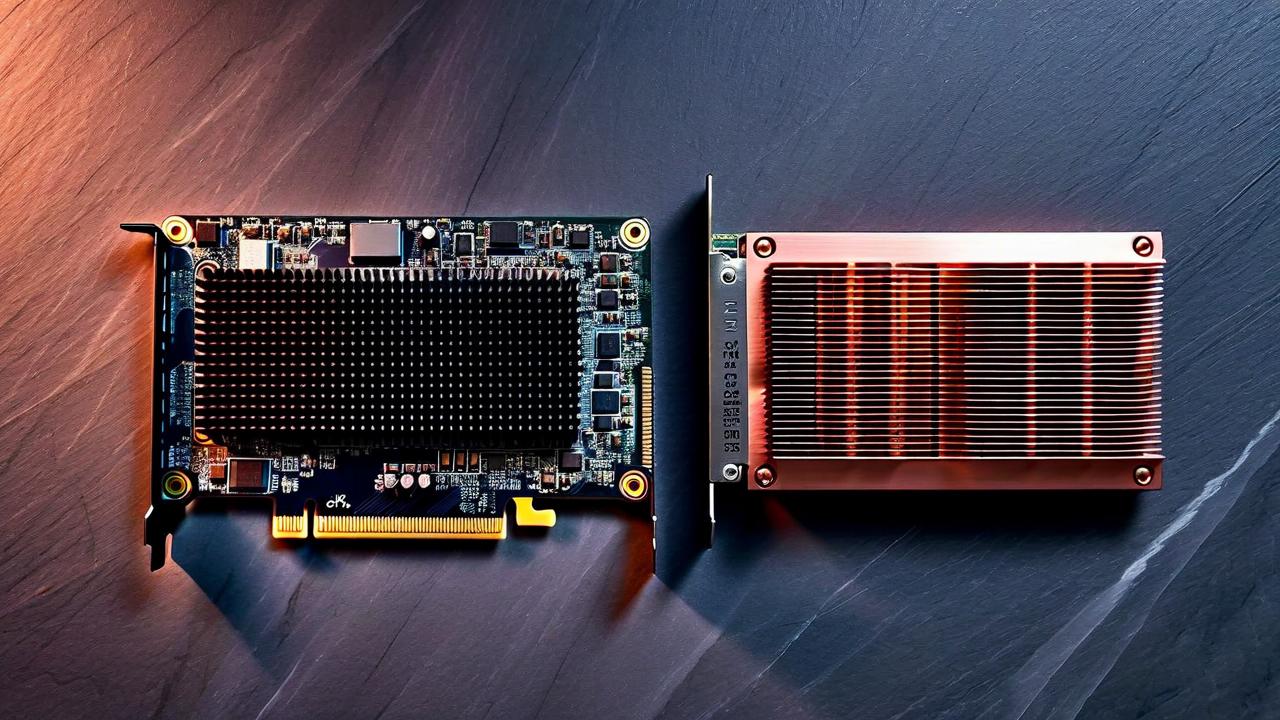
*this image is generated using AI for illustrative purposes only.
Advanced Micro Devices Inc. (NASDAQ: AMD) shares rose 3.05% to $576.89 in Monday’s premarket trading, reflecting a broader market rally and renewed investor appetite for growth stocks.
The Nasdaq futures gained 0.98%, while S&P 500 futures rose 0.67%. AMD’s movement appears tied largely to this stronger market backdrop, with no single company-specific headline driving the stock early Monday.
Technical Position
AMD remains in a strong long-term uptrend, having gained about 250% over the past 12 months. The stock is trading close to its 52-week high, making it sensitive to broader shifts in risk appetite.
At its premarket price of $576.90, the stock stood:
- 18.1% above its 20-day simple moving average (SMA) of $490.75
- 16.9% above its 50-day SMA of $495.85
- 63.5% above its 200-day SMA of $354.62
However, the near-term setup shows signs of consolidation. The 20-day SMA remains below the 50-day average, a bearish crossover that can signal short-term volatility. Despite this, the broader trend remains bullish as the 50-day SMA is well above the 200-day average.
Momentum indicators suggest buyers are regaining control after a previous pullback. The MACD is above its signal line, with a positive histogram. Resistance sits near $584.50, close to the 52-week high, while support is around $498, near shorter-term moving averages.
Analyst Outlook
AMD carries a Buy consensus rating with an average price forecast of $604. Recent analyst actions include:
| Firm | Action | Date | Rating | Price Target |
|---|---|---|---|---|
| Piper Sandler | Initiated coverage | Sept. 10 | Overweight | $600 |
| Raymond James | Upgraded | Aug. 25 | Strong Buy | $641 |
| BMO Capital | Initiated coverage | Aug. 21 | Outperform | $550 |
The stock trades at a price-to-earnings ratio of about 142.8, reflecting a premium valuation.
What the Numbers Show
AMD scores highly for momentum (99.07), growth (95.61), and quality (94.57) on the Benzinga Edge Rankings. However, its Value score is just 3.68. This divergence highlights that while the stock exhibits strong price momentum and growth characteristics, its valuation leaves little room for disappointment, contrasting sharply with its high growth metrics.

How might the bearish crossover between AMD's 20-day and 50-day SMAs impact short-term volatility if broader market risk appetite shifts?
Given AMD's high P/E ratio of 142.8, what specific earnings growth rates are required to justify this premium valuation in the next fiscal year?
Could resistance near the $584.50 level trigger a technical pullback toward the $498 support zone if momentum indicators fail to sustain positive histograms?
 19
19














 Access Market Heat-map & Insights
  Create, Save & Share your Screener
  Use 200+ Screening Filters





