

Alivus FY26 PAT Rises 16.2%; Earnings Call Transcript Live


Alivus Life Sciences reported a 16.2% YoY increase in PAT for FY26 to ₹5,645 Mn, driven by a 6.9% revenue growth to ₹25,518 Mn and a 360 bps expansion in EBITDA margins to 33.6%. The Board recommended a final dividend of ₹5 per share. The company confirmed the upload of the Q4 & FY26 earnings call transcript to its website.


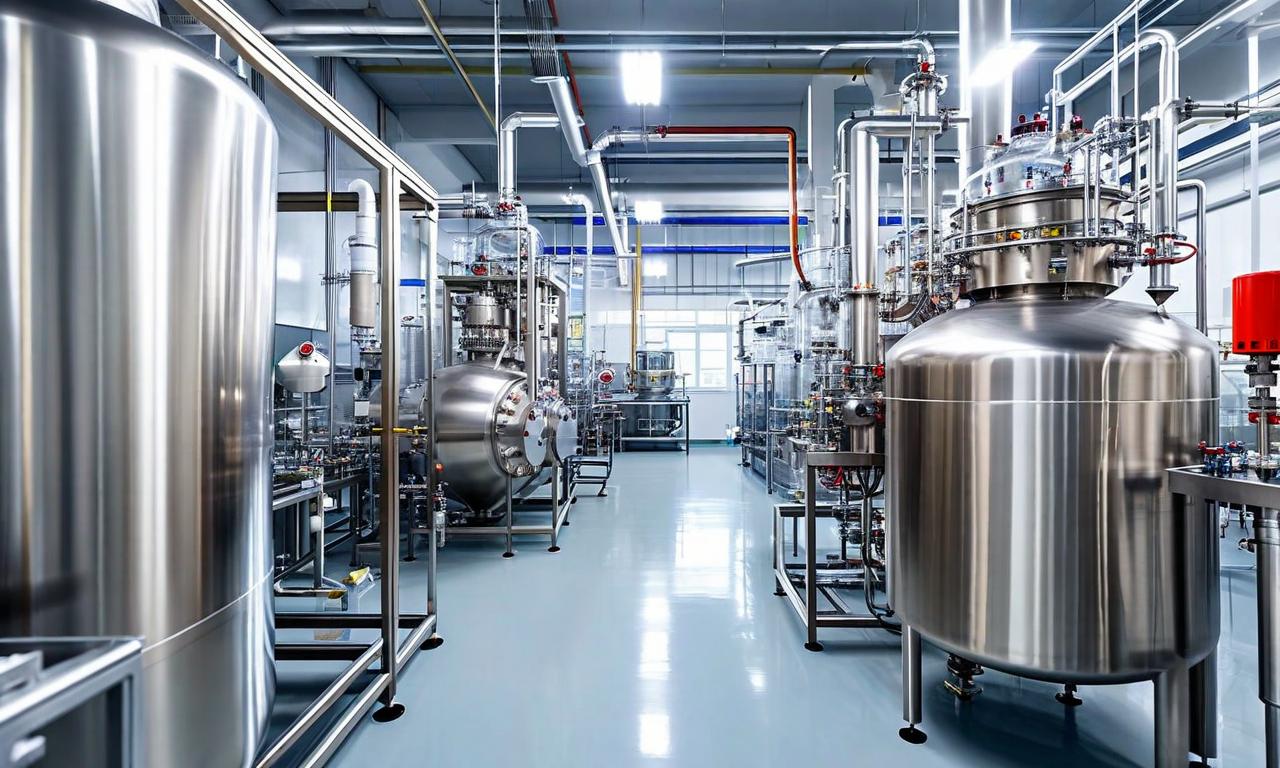
*this image is generated using AI for illustrative purposes only.
Alivus Life Sciences Limited announced its audited financial results for the quarter and year ended March 31, 2026, approved by the Board of Directors at its meeting held on May 14, 2026. The company reported broad-based financial improvement across revenue, margins, and profitability for both the quarter and the full fiscal year, supported by strong momentum in its Non-GPL business and a CDMO turnaround in the second half. The Board also recommended a final equity dividend of ₹5 per share (250%) for FY26, subject to shareholder approval at the ensuing Annual General Meeting. Subsequently, pursuant to Regulation 30 and 46 read with Part A of Schedule III of the SEBI (Listing Obligations and Disclosure Requirements) Regulations, 2015, the company confirmed the upload of the audio recording and transcript of the Q4 & FY2025-26 Earnings Call held on May 15, 2026, to its official website.
Q4FY26 & FY26 Financial Highlights
For FY26, Alivus registered Revenue from operations of ₹25,518 Mn, a growth of 6.9% year-on-year. For Q4FY26, Revenue from operations was ₹6,891 Mn, a growth of 6.1% year-on-year. EBITDA for FY26 was at ₹8,577 Mn, a growth of 19.6% year-on-year, with EBITDA margins at 33.6%, up 360 basis points YoY. For Q4FY26, EBITDA was at ₹2,373 Mn, a growth of 13.8% year-on-year, with margins at 34.4%, up 230 basis points YoY.
PAT for FY26 stood at ₹5,645 Mn, a growth of 16.2% year-on-year, with PAT margins at 22.1%, up 180 basis points YoY. PAT for Q4FY26 stood at ₹1,627 Mn, a growth of 14.7% year-on-year, with margins at 23.6%, up 180 basis points YoY. During FY26, the company generated a strong free cash flow of ₹2,590 Mn, leading to Cash and Cash Equivalents (including short-term investments) of ₹7,824 Mn as of March 31, 2026. The following table summarises the key quarterly and annual financial metrics:
| Particulars (In ₹ Million): | Q4FY26 | Q3FY26 | QoQ | Q4FY25 | YoY | FY26 | FY25 | YoY |
|---|---|---|---|---|---|---|---|---|
| Revenue from Operations: | 6,891 | 6,729 | 2.4% | 6,496 | 6.1% | 25,518 | 23,869 | 6.9% |
| Gross Profit: | 4,182 | 3,965 | 5.5% | 3,670 | 14.0% | 14,853 | 13,061 | 13.7% |
| Gross Profit (%): | 60.7% | 58.9% | +180 bps | 56.5% | +420 bps | 58.2% | 54.7% | +350 bps |
| EBITDA: | 2,373 | 2,452 | -3.2% | 2,085 | 13.8% | 8,577 | 7,172 | 19.6% |
| EBITDA Margin (%): | 34.4% | 36.4% | -200 bps | 32.1% | +230 bps | 33.6% | 30.0% | +360 bps |
| PBT (before exceptional items): | 2,158 | 2,241 | -3.7% | 1,913 | 12.8% | 7,771 | 6,542 | 18.8% |
| PAT: | 1,627 | 1,503 | 8.3% | 1,419 | 14.7% | 5,645 | 4,857 | 16.2% |
| Net Margin (%): | 23.6% | 22.3% | +130 bps | 21.8% | +180 bps | 22.1% | 20.3% | +180 bps |
Earnings Per Share & Dividend
The Board of Directors recommended a final dividend of ₹5 per equity share of face value ₹2 each (250%) for FY26, subject to shareholder approval at the ensuing Annual General Meeting. The audited results carry an unmodified opinion from statutory auditors Walker Chandiook & Co LLP. The following table presents the earnings per share metrics:
| Metric: | Q4FY26 | Q3FY26 | Q4FY25 | FY26 | FY25 |
|---|---|---|---|---|---|
| Basic EPS (₹): | 13.23 | 12.25 | 11.57 | 45.99 | 39.63 |
| Diluted EPS (₹): | 13.22 | 12.22 | 11.55 | 45.90 | 39.52 |
| Paid-up Equity Share Capital (₹ Mn): | 245.47 | 245.36 | 245.07 | 245.47 | 245.07 |
Balance Sheet Highlights
As at March 31, 2026, Alivus reported Total Assets of ₹39,828.97 Mn compared to ₹34,114.53 Mn a year earlier. Total Equity stood at ₹33,321.32 Mn, up from ₹28,173.72 Mn. Non-Current Assets grew to ₹13,335.37 Mn from ₹10,762.95 Mn, reflecting ongoing capital expenditure including Solapur Phase 1 and 1.1 construction. Investment in Mutual Funds (current) stood at ₹7,803.79 Mn as at March 31, 2026. The company maintained a debt-free balance sheet with Other Equity of ₹33,075.85 Mn. The following table presents a summary of the balance sheet:
| Particulars (₹ Mn): | 31st March 2026 | 31st March 2025 |
|---|---|---|
| Total Non-Current Assets: | 13,335.37 | 10,762.95 |
| Total Current Assets: | 26,493.60 | 23,351.58 |
| Total Assets: | 39,828.97 | 34,114.53 |
| Total Equity: | 33,321.32 | 28,173.72 |
| Total Non-Current Liabilities: | 1,427.30 | 1,239.22 |
| Total Current Liabilities: | 5,080.35 | 4,701.59 |
| Total Liabilities: | 6,507.65 | 5,940.81 |
Cash Flow Summary
For FY26, Net Cash Generated from Operating Activities was ₹5,654.13 Mn, compared to ₹3,915.24 Mn in FY25. Net Cash used in Investing Activities was ₹5,701.53 Mn, driven primarily by capital expenditure of ₹3,070.55 Mn and investment in Fixed Deposits/Mutual Funds of ₹4,950.03 Mn, partially offset by redemption of Mutual Funds of ₹2,302.92 Mn. Net Cash used in Financing Activities was ₹643.40 Mn, which included dividend paid of ₹613.41 Mn. The closing balance of Cash and Cash Equivalents stood at ₹19.82 Mn as at March 31, 2026.
| Particulars (₹ Mn): | FY26 | FY25 |
|---|---|---|
| Net Cash from Operating Activities: | 5,654.13 | 3,915.24 |
| Net Cash used in Investing Activities: | (5,701.53) | (6,156.45) |
| Net Cash used in Financing Activities: | (643.40) | (62.31) |
| Closing Cash & Cash Equivalents: | 19.82 | 710.62 |
Management Commentary
Dr. Yasir Rawjee, MD & CEO, stated that FY26 reflected a clear improvement in operating performance, with revenue growing 6.9% year-on-year supported by 13% growth in the non-GPL business. The CDMO business delivered a planned turnaround in the second half, closing the year with 18% YoY growth. He expressed confidence in delivering high single-digit revenue growth for FY27, with margins sustained above 30%.
Tushar Mistry, CFO, highlighted that the company ended FY26 with 6.9% growth and EBITDA margins of 33.6%, exceeding the guided range of 30–32%. He attributed the performance to a favourable product mix and disciplined control over operating expenses, noting strong operating cash flows that provide flexibility for growth initiatives while maintaining a healthy, debt-free balance sheet.
Business Segment and Operational Updates
The Generic API segment contributed 93% of total revenue in Q4FY26, recording revenue of ₹6,343 Mn. The CDMO segment, contributing 7% of the total portfolio in FY26, posted revenue of ₹453 Mn in Q4FY26. On a full-year basis, the CDMO business delivered 18% year-on-year growth. The Non-GPL business grew 13% for the full year FY26, now contributing 71% of total revenues.
DMF / CEP filings continue across major markets, taking the total cumulative filings to 611 as of March 31, 2026. The HP API portfolio has 28 APIs in the active grid, with 12 products validated and seven products in advanced stages of development. Solapur Phase 1 and 1.1 construction work is in progress for 465 KL capacity. The company has also acquired land in Taloja (Navi Mumbai) admeasuring 10,000 square meters to establish a state-of-the-art R&D centre.
Earnings Call Transcript
In compliance with Regulation 30 and 46 read with Part A of Schedule III of the SEBI (Listing Obligations and Disclosure Requirements) Regulations, 2015, Alivus Life Sciences confirmed the upload of the transcript of the Earnings Call held on Friday, May 15, 2026 for the fourth quarter and year ended March 31, 2026. The transcript is available on the company's official website. The filing was signed by Rudalf Corriea, Company Secretary & Compliance Officer.
Historical Stock Returns for Alivus Life Sciences
| 1 Day | 5 Days | 1 Month | 6 Months | 1 Year | 5 Years |
|---|---|---|---|---|---|
| -2.41% | -2.07% | -2.84% | +22.97% | +40.14% | 0.0% |

How will the completion of Solapur Phase 1 and 1.1 (465 KL capacity) impact Alivus's revenue mix and margin profile in FY27 and beyond?
Can the CDMO segment sustain its H2 FY26 turnaround momentum and grow its contribution beyond the current 7% of total revenues?
How might the new Taloja R&D centre influence Alivus's HP API pipeline expansion and competitive positioning in high-value generic APIs?
 17
17





 Access 50+ Readymade Screeners
  Use 200+ Custom Filters
  Get Full Market Insights





