

Adani Power Q1FY27 Results: Net profit rises 47% YoY to ₹4,867 crore


- Net profit rose 47% YoY to ₹4,867 crore in Q1FY27
- Revenue from operations grew 33% to ₹18,901 crore
- EBITDA margin expanded to 43% from 40% in FY26
- Plant load factor improved to 78% from 67% in FY26
- Net debt-to-continuing EBITDA ratio stable at 2.12x

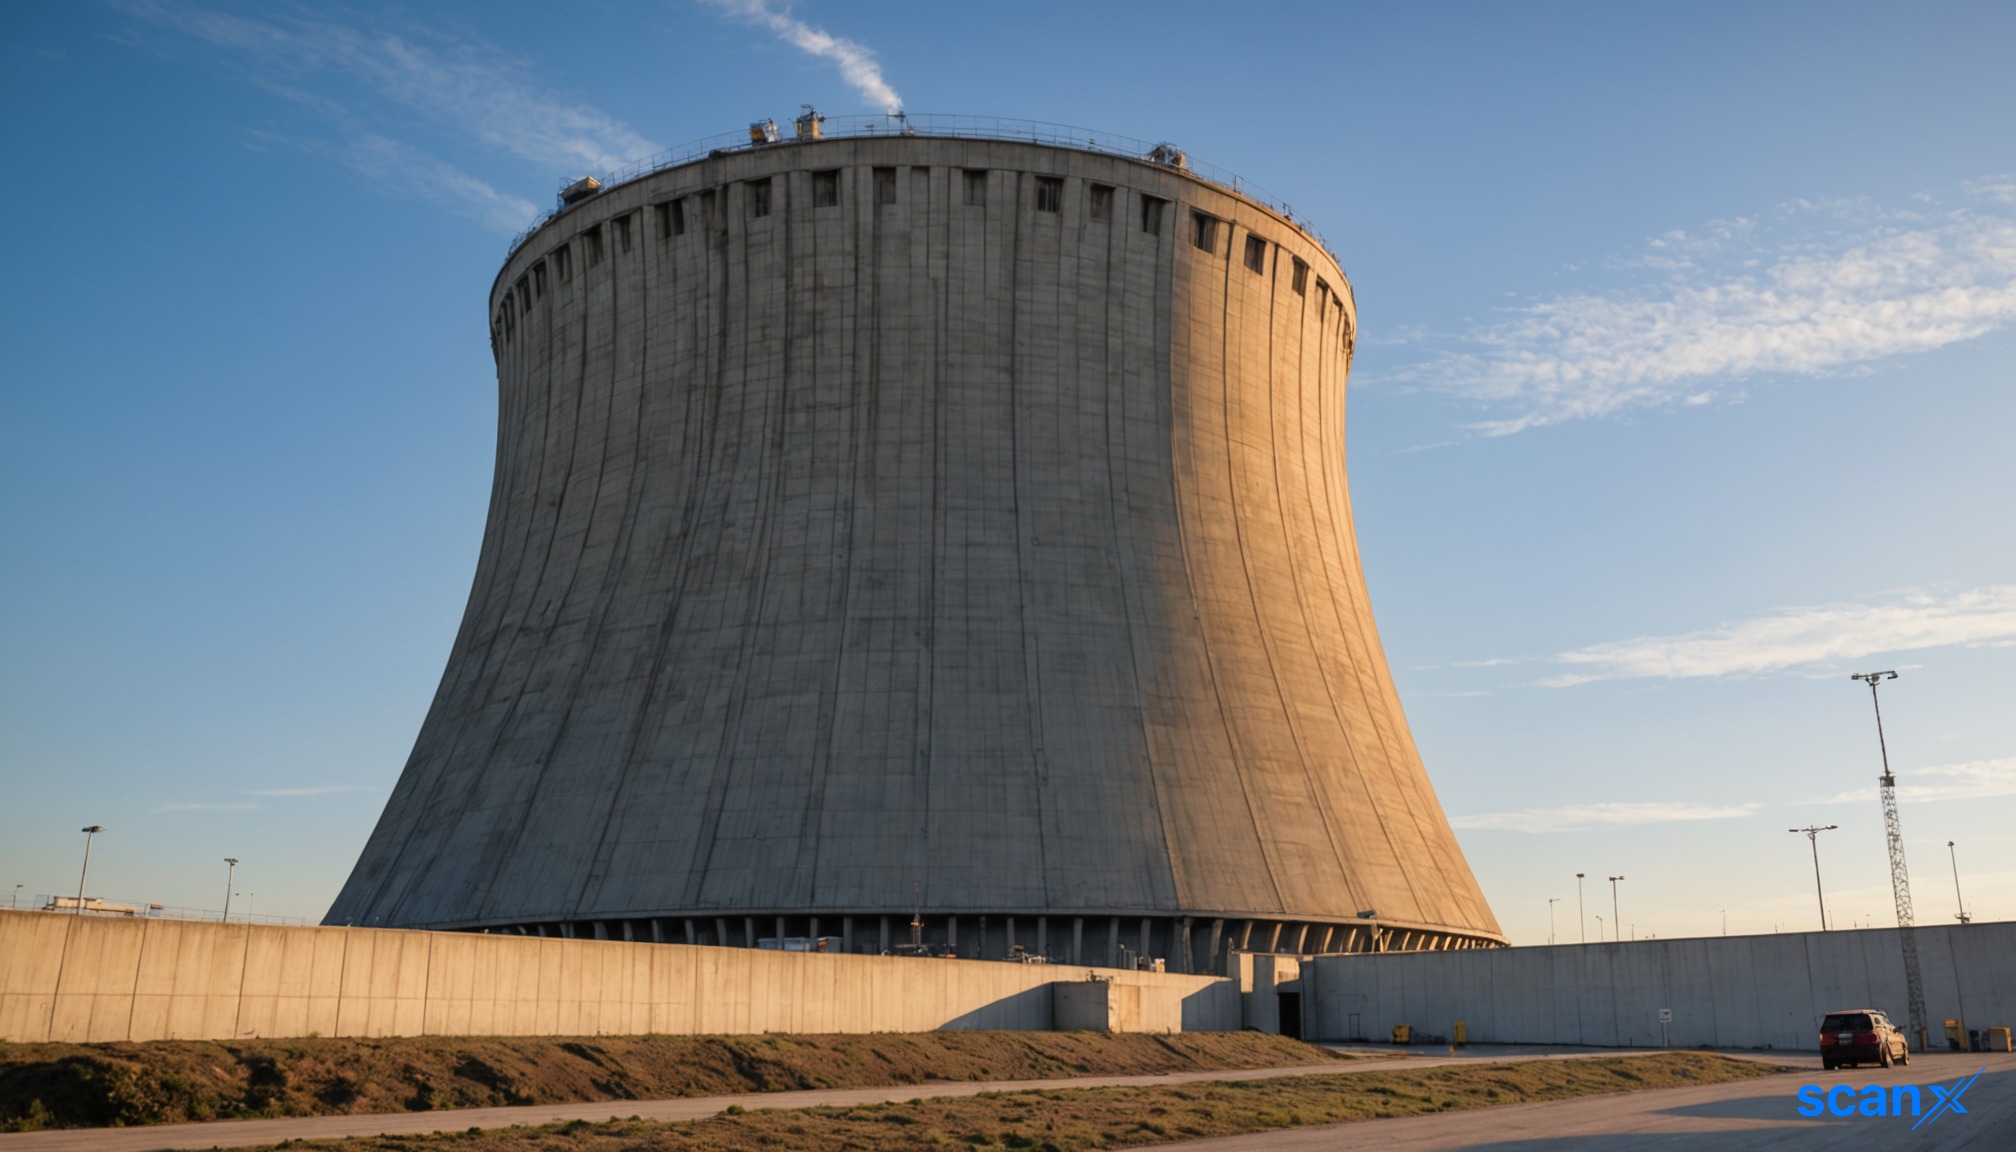

*this image is generated using AI for illustrative purposes only.
Adani Power Limited reported a sharp recovery in profitability for the first quarter of FY27, with net profit surging 47% year-on-year to ₹4,867 crore. The company’s revenue from operations climbed 33% to ₹18,901 crore, supported by improved plant load factors and higher merchant realizations.
The Mumbai-based power producer delivered an EBITDA of ₹8,369 crore for the quarter, marking a 36% increase compared to the same period last year. This operational improvement coincided with a rise in the EBITDA margin to 43%, up from 40% in FY26.
Operational Metrics
The financial performance was underpinned by stronger utilization rates across its thermal portfolio. Key operational indicators for Q1FY27 included:
| Metric | Value | Change |
|---|---|---|
| Plant Load Factor (PLF) | 78% | Up from 67% in FY26 |
| Plant Availability | 96% | Up from 89% in FY26 |
| Effective Capacity | 18,150 MW | Stable |
Adani Power’s merchant realization improved significantly to ₹7.05 per kWh in Q1FY27, compared to ₹5.30 per kWh in FY26. Meanwhile, PPA realization stood at ₹5.93 per kWh, slightly higher than the ₹5.53 per kWh recorded in FY26.
What the Numbers Show
A notable divergence exists between the growth in operating revenue and total income. While revenue from operations grew 33%, total income increased by only 16% to ₹19,322 crore. This disparity is driven by other income, which fell to ₹420 crore in Q1FY27 from ₹3,625 crore in FY26. Consequently, the surge in net profit is primarily attributable to core operational efficiency and volume growth rather than non-operating gains, highlighting a more sustainable earnings base.
Balance Sheet and Capital Structure
As of June 2026, Adani Power’s net debt stood at ₹47,643 crore. The net debt-to-continuing EBITDA ratio remained stable at 2.12x on a trailing twelve-month basis. The company maintains a strong liquidity position with cash and cash equivalents totaling ₹8,418 crore as of March 2026.
Return metrics also showed resilience, with return on equity (RoE) at 22.6% and return on capital employed (RoCE) at 19.5% for the trailing twelve months ending June 2026.
Growth Pipeline
Adani Power continues to expand its footprint with a locked-in capacity of 23.7 GW across 13 projects. The company targets a total capacity of 42.05 GW by FY32. Recent wins include long-term power purchase agreements (PPAs) totaling 13.9 GW, securing demand visibility in key states such as Maharashtra, Madhya Pradesh, and Bihar.
Historical Stock Returns for Adani Power
| 1 Day | 5 Days | 1 Month | 6 Months | 1 Year | 5 Years |
|---|---|---|---|---|---|
| -3.26% | -5.06% | -4.94% | +27.65% | +31.64% | 0.0% |

How sustainable is the 43% EBITDA margin given the volatility in coal prices and potential regulatory changes in merchant power tariffs?
What specific strategies is Adani Power employing to manage its ₹47,643 crore net debt while funding the expansion to 42.05 GW by FY32?
How will the shift towards renewable energy integration impact the utilization rates and profitability of Adani Power's existing thermal portfolio?
 18
18







 Access 50+ Readymade Screeners
  Use 200+ Custom Filters
  Get Full Market Insights





