

Adani Power posts record ₹4,867 crore Q1FY27 profit on volume surge


Adani Power delivered record Q1FY27 profits of ₹4,867 crore, supported by increased dispatch volumes and improved tariff realizations. The updated investor presentation highlights a strategic roadmap to reach 45 GW capacity, backed by significant long-term PPA coverage and recent capital raises.


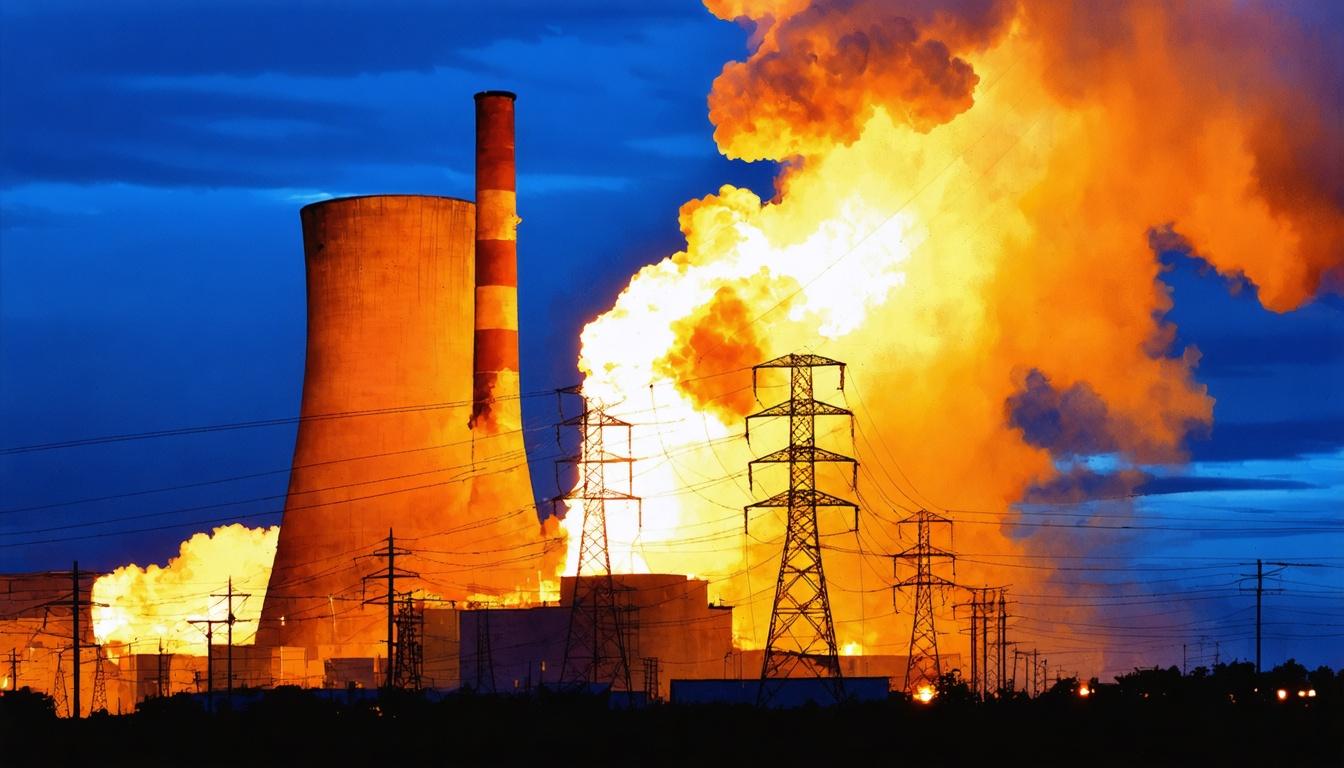
*this image is generated using AI for illustrative purposes only.
Adani Power Limited reported a record quarterly profit after tax (PAT) of ₹4,867 crore for Q1FY27, driven by a 17% surge in power dispatch to 28.8 billion units. The strong operational performance coincides with the release of its August 2026 investor presentation, which reaffirms the company’s strategy to expand its portfolio to 45 GW while maintaining high long-term contract visibility. This combination of immediate profitability and secured growth pipeline underscores Adani Power’s position as India’s largest private thermal independent power producer, offering investors stable cash flows amid rising national energy demand.
The financial results were filed with BSE Limited and National Stock Exchange of India Limited on July 29, 2026. The subsequent investor presentation, signed by Company Secretary Puneet Bansal on August 1, 2026, details the structural advantages supporting this growth. Management highlighted that 95% of the current 18.33 GW operating capacity is tied up in long-term power purchase agreements (PPAs), significantly reducing revenue volatility. CEO Shersingh B Khyalia attributed the Q1 performance to robust execution during peak summer demand, which pushed India’s peak power demand to a record 271 GW in May 2026.
Financial Performance and Drivers
Adani Power’s continuing revenue grew 27% year-on-year to ₹17,936 crore, while continuing EBITDA rose 22% to ₹6,983 crore. Total reported revenue stood at ₹19,322 crore, including a one-time net recognition of prior period revenues of ₹1,386 crore. CFO Dilip Jha noted that tariff realization under PPAs improved 8% to ₹5.93 per unit, while merchant realizations rose 13% to ₹7.04 per unit. Fuel costs increased 30% to ₹9,513 crore due to higher volumes and imported coal indices, but were offset by volume growth and capacity charges.
| Metric | Q1FY27 | Q1FY26 | Change |
|---|---|---|---|
| PAT (₹ crore) | 4,867 | 3,305 | +47% |
| Continuing Revenue (₹ crore) | 17,936 | 14,123* | +27% |
| Continuing EBITDA (₹ crore) | 6,983 | 5,724* | +22% |
| PLF (%) | 78 | 67 | +11 pts |
| Dispatch (Billion Units) | 28.8 | 24.6* | +17% |
Figures for Q1FY26 derived from growth percentages provided in source.
Strategic Expansion and Capacity Roadmap
The August 2026 presentation outlines a clear path to reach 45 GW of total capacity. The company currently operates 18.33 GW, with an additional 23.72 GW of organic projects locked-in through land availability and equipment orders. Key upcoming additions include the 1,320 MW Korba Phase-II project, expected before December 2026, and the 1,600 MW Mahan Phase-II scheduled for Q1FY28. Capex guidance stands at ₹25,000 crore for FY27, ₹33,000 crore for FY28, and over ₹35,000 crore thereafter.
Recent acquisitions include an 180-MW Churk power plant from Jaiprakash Associates, alongside stakes in Jaiprakash Power Ventures and Prayagraj Power Generation Company. The Board has approved an enabling provision for a Qualified Institutional Placement (QIP) to fund future requirements, although no timeline has been set. The company recently raised ₹15,000 crore through a QIP in July 2026, revising promoter shareholding to 71.97%.
What the Numbers Show
The shift from merchant to PPA-based sales significantly stabilizes earnings visibility. With 95% of capacity now tied under long-term contracts, revenue volatility from spot market fluctuations is reduced. The 47% PAT growth outpaced the 27% revenue growth, indicating operating leverage as fixed costs were spread over higher volumes. The strategic acquisition of Jaiprakash assets adds immediate scale, while the pending nuclear policy clarity delays entry into that segment beyond 2035. Strong liquidity allows Adani Power to fund the majority of its expansion capex through internal accruals, keeping net debt-to-EBITDA slightly above 2 times.
Historical Stock Returns for Adani Power
| 1 Day | 5 Days | 1 Month | 6 Months | 1 Year | 5 Years |
|---|---|---|---|---|---|
| +0.53% | -3.67% | -9.31% | +11.63% | +27.03% | +830.12% |

How will the projected 30% increase in fuel costs impact Adani Power's EBITDA margins if imported coal indices remain elevated in FY27?
What are the specific regulatory or environmental hurdles that could delay the commissioning of the Korba Phase-II and Mahan Phase-II projects?
Given the 95% PPA coverage, how exposed is Adani Power to renegotiation risks as existing long-term contracts mature over the next decade?
 19
19










 Access 50+ Readymade Screeners
  Use 200+ Custom Filters
  Get Full Market Insights





