Silver Overtakes Nvidia to Become World's Second Most Valuable Asset at $4.7T


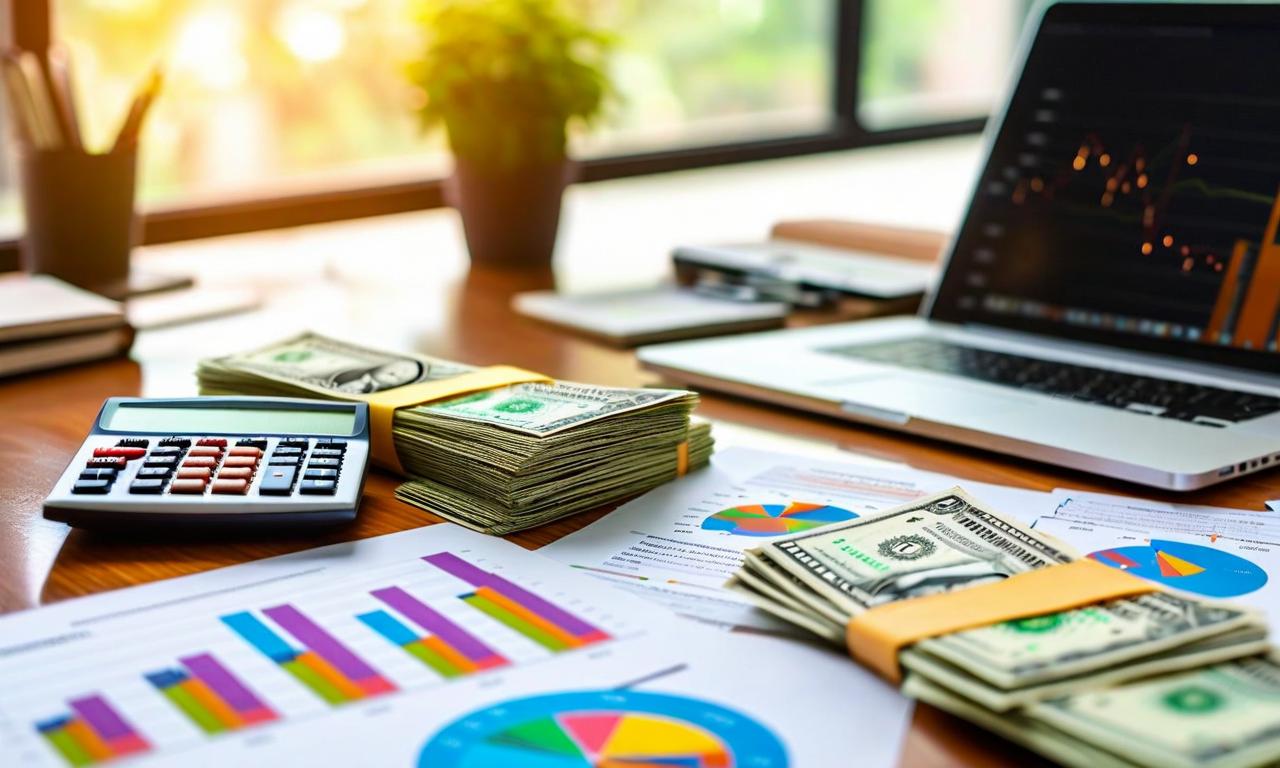
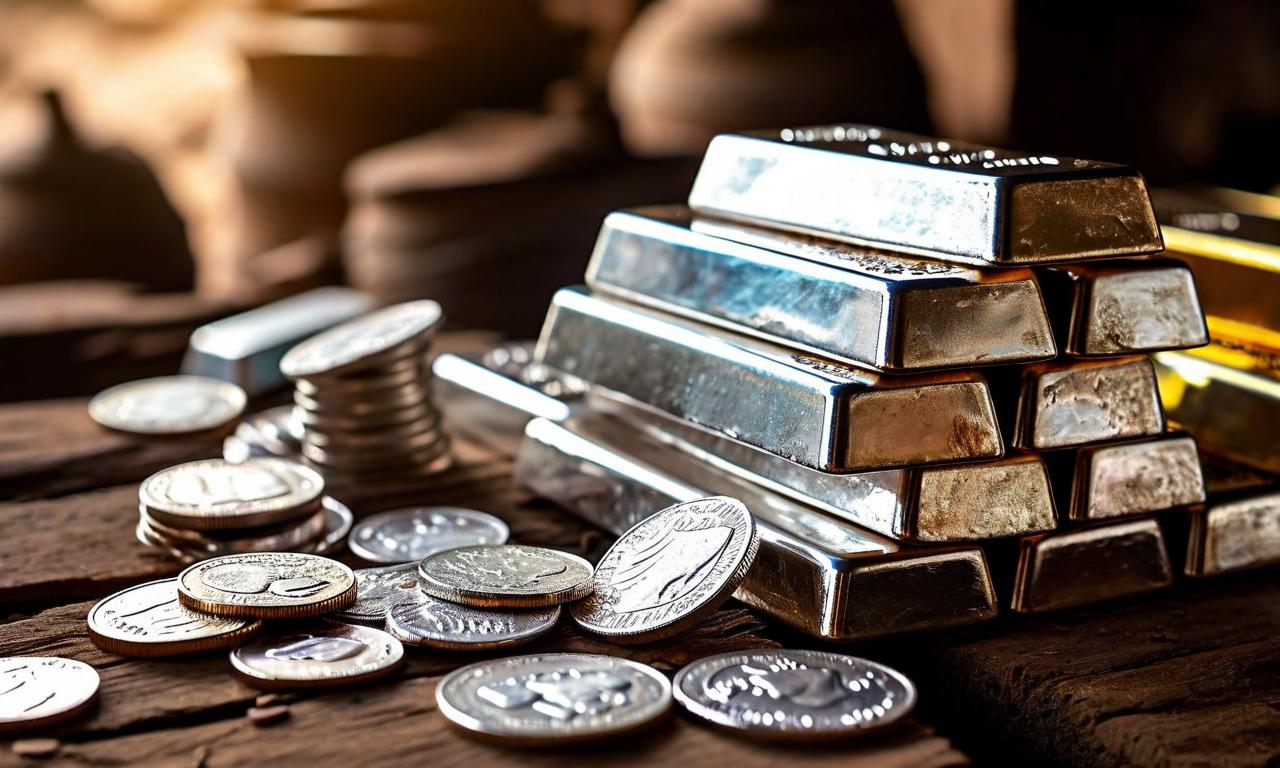
Silver has surpassed Nvidia to become the world's second most valuable asset with a market capitalization of $4.7 trillion, driven by prices crossing $84 per ounce and delivering approximately 170% year-to-date gains. The precious metal benefits from its dual role as both a store of value and critical industrial input for electric vehicles, solar panels, and AI data centers, while facing its fifth consecutive year of supply deficits.

*this image is generated using AI for illustrative purposes only.
Silver has achieved another historic milestone by surpassing Nvidia to become the world's second most valuable asset, with its market capitalization reaching $4.7 trillion compared to Nvidia's $4.6 trillion. The precious metal continues its exceptional rally with prices crossing the $84.00 per ounce mark, delivering remarkable year-to-date gains of approximately 170%.
Global Asset Rankings and Market Capitalization
Silver's unprecedented performance has further reshaped the global asset hierarchy, now securing the second position:
| Ranking | Asset | Market Cap |
|---|---|---|
| 1st | Gold | $31.5 trillion |
| 2nd | Silver | $4.7 trillion |
| 3rd | Nvidia | $4.6 trillion |
| 4th | Apple Inc. | $4.0 trillion |
| 5th | Alphabet | $3.8 trillion |
| 6th | Microsoft | $3.6 trillion |
| 7th | Bitcoin | $1.8 trillion |
Price Performance and Market Dynamics
The precious metal's exceptional rally demonstrates sustained momentum, significantly outpacing other major assets:
| Metric | Performance |
|---|---|
| Current Price | Above $84.00 per ounce |
| Year-to-Date Gains | Approximately 170% |
| Gold YTD Performance | 72% |
| Market Status | Second most valuable global asset |
| Technical Indicator | RSI near 80 (overbought territory) |
Industrial Demand and Supply Fundamentals
Silver's dual identity as both a precious metal and industrial commodity has proved explosive for its valuation. The metal serves as a critical input across multiple high-growth sectors:
| Application | Usage |
|---|---|
| Electric Vehicles | Critical component |
| Solar Panels | Essential material |
| AI Data Centers | Infrastructure component |
| Electronics | Core manufacturing input |
The silver market is experiencing its fifth consecutive year of supply deficits, with mining output failing to keep pace with consumption. Above-ground inventories have reached near historic lows, while warehouse data from the Shanghai Futures Exchange shows silver inventories fell to their lowest levels since 2015.
Federal Reserve Policy and Market Structure
Following three rate cuts by the US Federal Reserve, investors are betting on further easing into 2026. Lower interest rates have amplified the appeal of non-yielding assets like silver, while a weaker dollar has added fuel to the rally.
Unlike gold, which benefits from deep liquidity and vast lending pools estimated at around $700 billion in London, silver operates in a thinner market structure. This fragility was exposed during a historic supply squeeze in October, contributing to the metal's volatile price movements.
Recent Market Activity and Outlook
After surging to record highs, silver showed signs of profit-taking with prices falling as much as 5% following five straight days of gains. The 14-day relative strength index climbed close to 80, well above the 70 threshold typically seen as overbought territory.
Recent geopolitical developments, including US actions in Venezuela and Nigeria, have boosted safe-haven demand. Additionally, a US Commerce Department probe into critical mineral imports has raised prospects of tariffs or trade restrictions on silver, adding uncertainty to already tight supply chains.
Historical Stock Returns for Silver Oak India
| 1 Day | 5 Days | 1 Month | 6 Months | 1 Year | 5 Years |
|---|---|---|---|---|---|
| -0.25% | +5.40% | -0.48% | -14.78% | -47.21% | +187.18% |
 17
17