Sobha Ltd Targets 5.2-5.3M Sq Ft FY26 Completion With Q4 Projects Launch Plan


Sobha Ltd has set dual growth targets for FY26, expecting to complete 5.2-5.3 million square feet (16-17% increase from 4.54 million sq ft last year) while launching 3-4 new projects across Gurgaon, Greater Noida, Chennai, and Calicut totaling 5.5 million sq ft in Q4 to support its ambitious ₹8,500 crores sales target.


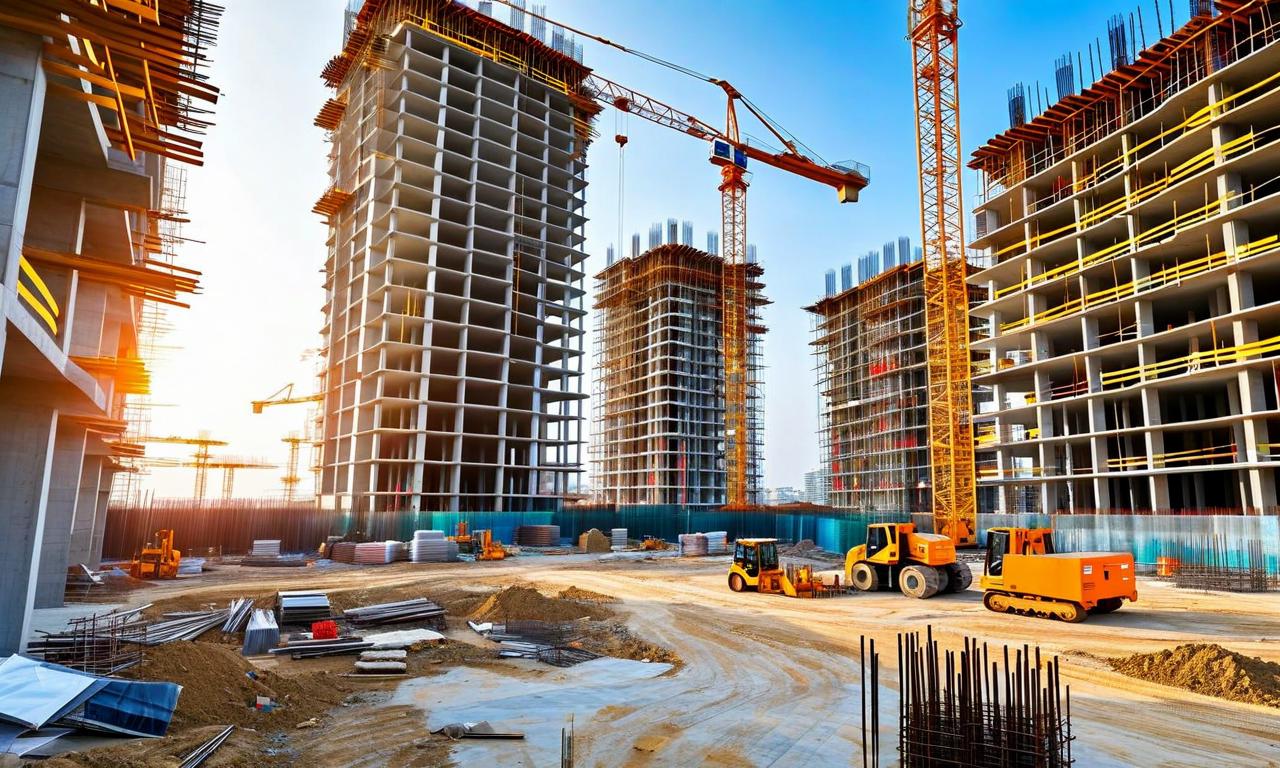
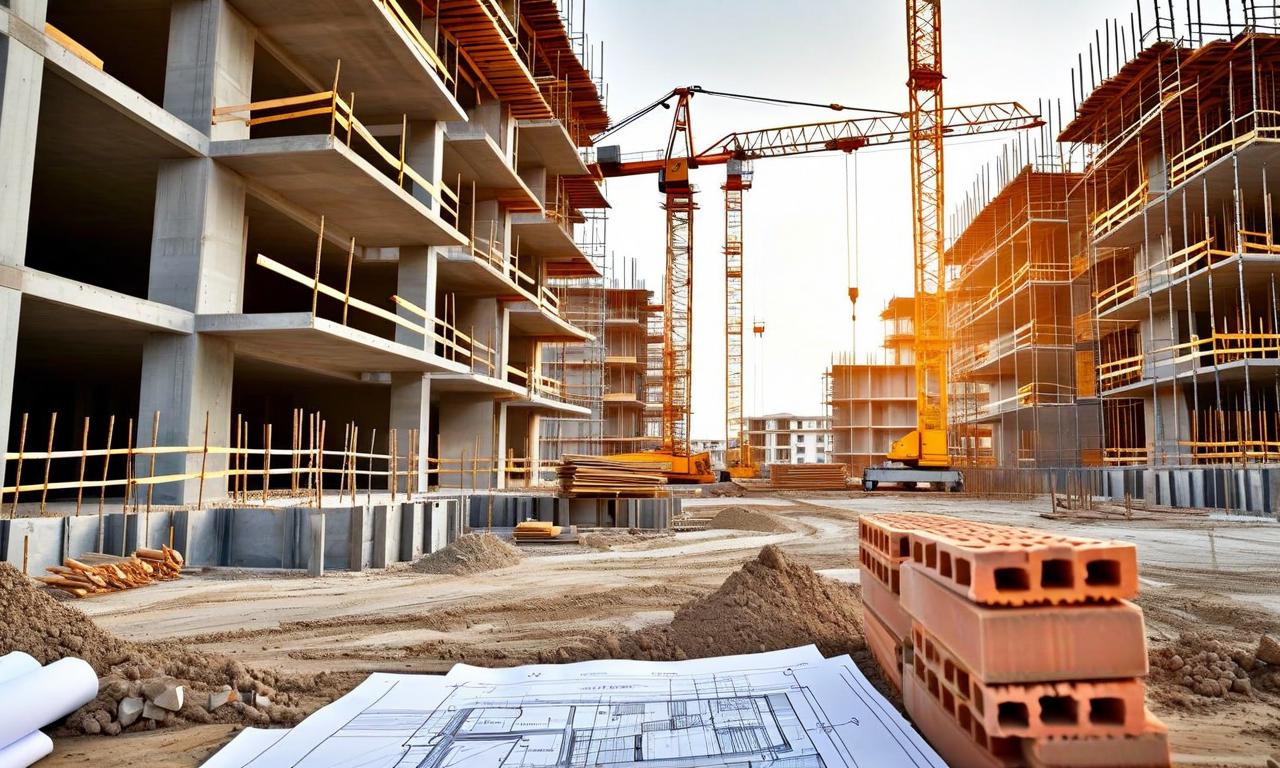
*this image is generated using AI for illustrative purposes only.
Sobha Ltd has outlined comprehensive growth plans for FY26, combining ambitious completion targets with strategic project launches. The real estate developer expects to complete 5.2-5.3 million square feet in FY26, representing a 16-17% increase from the previous year's 4.54 million square feet completion.
FY26 Completion and Delivery Targets
The company has set specific completion milestones for the current financial year, with Q4 FY26 expected to contribute significantly to the annual target. Sobha Ltd anticipates finishing 1.5-1.7 million square feet in the fourth quarter alone.
| Parameter: | Target/Achievement |
|---|---|
| FY26 Total Completion: | 5.2-5.3 million sq ft |
| Q4 FY26 Completion: | 1.5-1.7 million sq ft |
| Previous Year Completion: | 4.54 million sq ft |
| Growth Rate: | 16-17% |
Strategic Q4 FY26 Project Launch Initiative
Alongside completion targets, Sobha Ltd has set an ambitious annual sales target of ₹8,500.00 crores for FY26, expecting substantial 35% growth compared to the previous year's performance. The company plans to unveil 3-4 new projects in Q4 FY26 across strategic locations to support these targets.
| Location: | Project Size (Sq Ft) |
|---|---|
| Gurgaon: | 800,000 |
| Greater Noida: | 2,400,000 |
| Chennai: | 1,500,000 |
| Calicut: | 800,000 |
| Total Q4 Launches: | 5,500,000 |
Enhanced Market Positioning Strategy
The planned Q4 projects could significantly boost Sobha Ltd's total launch capacity for FY26 to 8.5 million square feet. This substantial increase in project launches aligns with the company's aggressive sales target and reflects its commitment to expanding market presence across multiple tier-1 and tier-2 cities.
| Strategic Metrics: | Details |
|---|---|
| FY26 Sales Target: | ₹8,500.00 crores |
| Expected Sales Growth: | 35% |
| Total FY26 Launch Potential: | 8.5 million sq ft |
| Q4 Project Count: | 3-4 new projects |
The combination of strong completion targets and strategic project launches positions Sobha Ltd for significant growth in FY26. The diversified geographical spread across key markets demonstrates the company's comprehensive approach to capitalizing on varied regional market dynamics while maintaining steady delivery momentum.
Historical Stock Returns for Sobha
| 1 Day | 5 Days | 1 Month | 6 Months | 1 Year | 5 Years |
|---|---|---|---|---|---|
| -0.08% | -6.89% | -4.68% | -0.62% | -16.38% | +129.66% |