Kansai Nerolac Paints Makes Audio Recording Available from Japan Promoter Meet


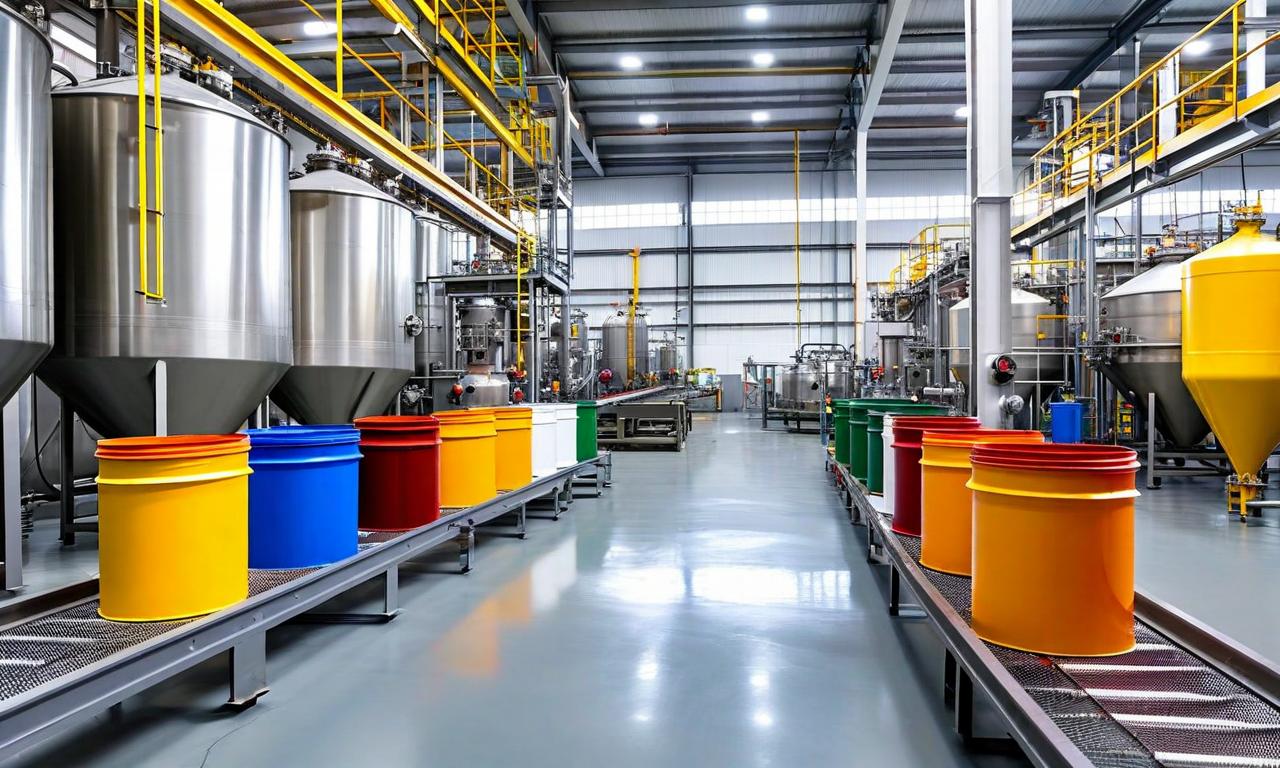
Kansai Nerolac Paints has made available the audio recording of the analyst meet hosted by its Japanese promoter Kansai Paint Co., Ltd. on February 26, 2026. The conference covered India operations strategy briefing, highlighting the company's balanced portfolio across automotive (#1 position), industrial (#3 general, #1 powder), and decorative (#3 position) segments with revenue of ₹7,500.00 crores in FY2024.

*this image is generated using AI for illustrative purposes only.
Kansai Nerolac Paints Limited has made available the audio recording of the analyst and institutional investor meet hosted by its Japanese promoter, Kansai Paint Co., Ltd., Japan, on February 26, 2026. The company filed the audio recording availability notice under Regulation 30 of SEBI (Listing Obligations and Disclosure Requirements) Regulations, 2015.
Conference Call Completion and Recording Access
The conference call was conducted on February 26, 2026, at 4:00 p.m. Japan Standard Time (12:30 p.m. Indian Standard Time) to discuss business strategy briefing regarding India operations. The audio recording has been uploaded on the company's website at https://www.nerolac.com/investors/conference-call-with-investors.html . The company has indicated that the transcript will be shared with stock exchanges and uploaded on the website in due course.
Strategic Portfolio Positioning
The presentation emphasized the company's balanced portfolio approach across three critical segments:
| Segment: | Market Position | Focus Areas |
|---|---|---|
| Automotive: | #1 in Auto, #4 in Auto Refinish | Market leadership and expansion |
| Industrial: | #3 in General Industrial, #1 in Powder | Growth acceleration |
| Decorative: | #3 in Decorative | Market optimization |
The company operates with a mission to contribute to India's development through its diversified portfolio catering to automotive, industrial, and construction sectors.
Business Transformation Framework
The presentation outlined key business transformation drivers categorized into growth and operational improvement areas. Growth drivers include portfolio management, One-Kansai initiative, and leveraging past M&A activities. Operational improvements focus on strategic resource allocation, asset utilization, enhanced agility, and Cash Conversion Cycle optimization.
Financial Performance Highlights
The company demonstrated consistent revenue growth over the last decade, with revenue reaching approximately ₹7,500.00 crores by FY2024. Operating profit peaked at about ₹850.00 crores in FY2023, showcasing resilient business fundamentals.
| Metric: | 31/Dec/2024 | 31/Dec/2025 | Improvement |
|---|---|---|---|
| Net Working Capital: | ~₹2,100.00 Cr | ~₹1,700.00 Cr | Reduced |
| Cash Conversion Cycle: | 94 days | 82 days | 12 days improvement |
Segment Performance Analysis
Automotive Segment: The company maintains dominant market share in India's 2/3-wheeler segment, representing the world's largest production hub with 18,500 units ('000). Market share improved from 58.10% in FY2022 to 61.00% in FY2024.
Industrial Segment: Growth segments including powder coatings, construction equipment, white goods, and furniture drive expansion through functionality strength and network expansion with 2,000+ dealers.
Decorative Segment: Despite competitive market conditions, the company sustains its #3 position through focused market approach, project segment growth of 10%+, and construction chemicals growth of 15%+.
Nerofix Integration and Strategic Collaborations
The Nerofix sales trend index reached 7.80 in FY2025, marking record-high sales progress. The organizational amalgamation aims to eliminate inefficiencies and create enhanced collaboration opportunities. The company maintains active collaboration with global Kansai Paint entities for technical support and business development across automotive and industrial segments.
Historical Stock Returns for Kansai Nerolac Paints
| 1 Day | 5 Days | 1 Month | 6 Months | 1 Year | 5 Years |
|---|---|---|---|---|---|
| +2.99% | -2.36% | -6.25% | -14.21% | -17.49% | -49.29% |
 16
16