NewsTransformers & Rectifiers faces 31% downside risk as InCred cuts target price despite strong Q3 results
Transformers & Rectifiers faces 31% downside risk as InCred cuts target price despite strong Q3 results


InCred has downgraded Transformers & Rectifiers India Limited with a 'Reduce' rating and cut the target price from ₹300 to ₹200, indicating 31.47% downside potential. The downgrade stems from a 19% decline in order intake during 9M FY26, flat order backlog over three quarters, and CEO Mukul Srivastava's resignation on January 7, 2026. Despite these concerns, the company reported strong Q3 FY26 results with revenue growing 31.71% YoY to ₹736.76 crore and net profit increasing 36.93% YoY to ₹75.97 crore. The company maintains a robust order book of ₹5,450 crore and has achieved a strategic milestone by entering the HVDC transformer segment.

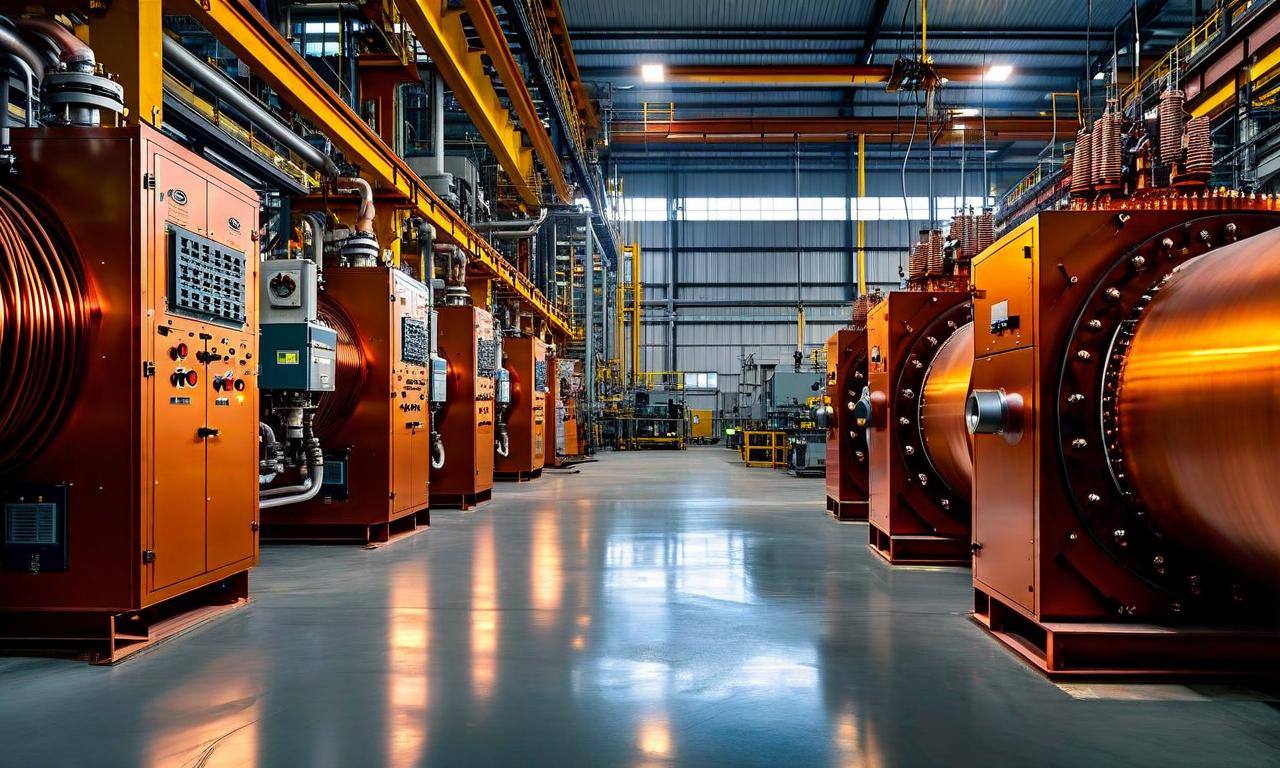
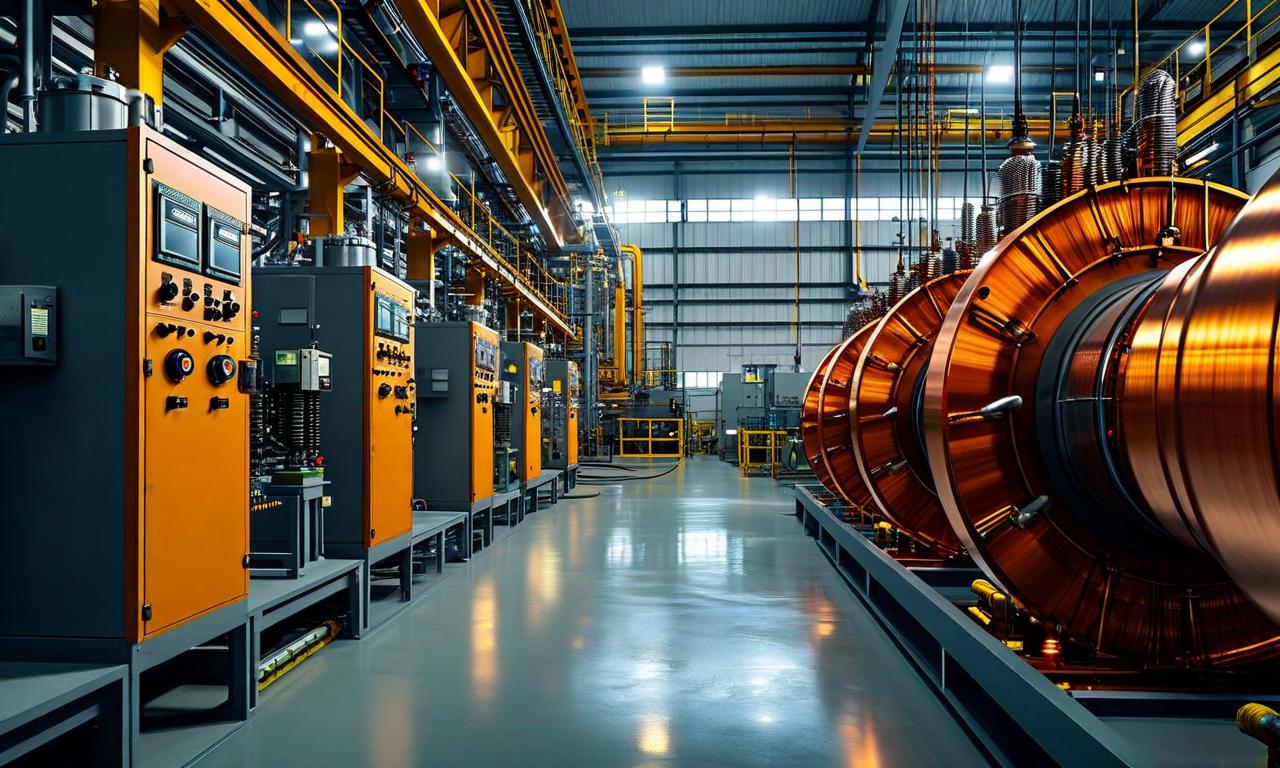
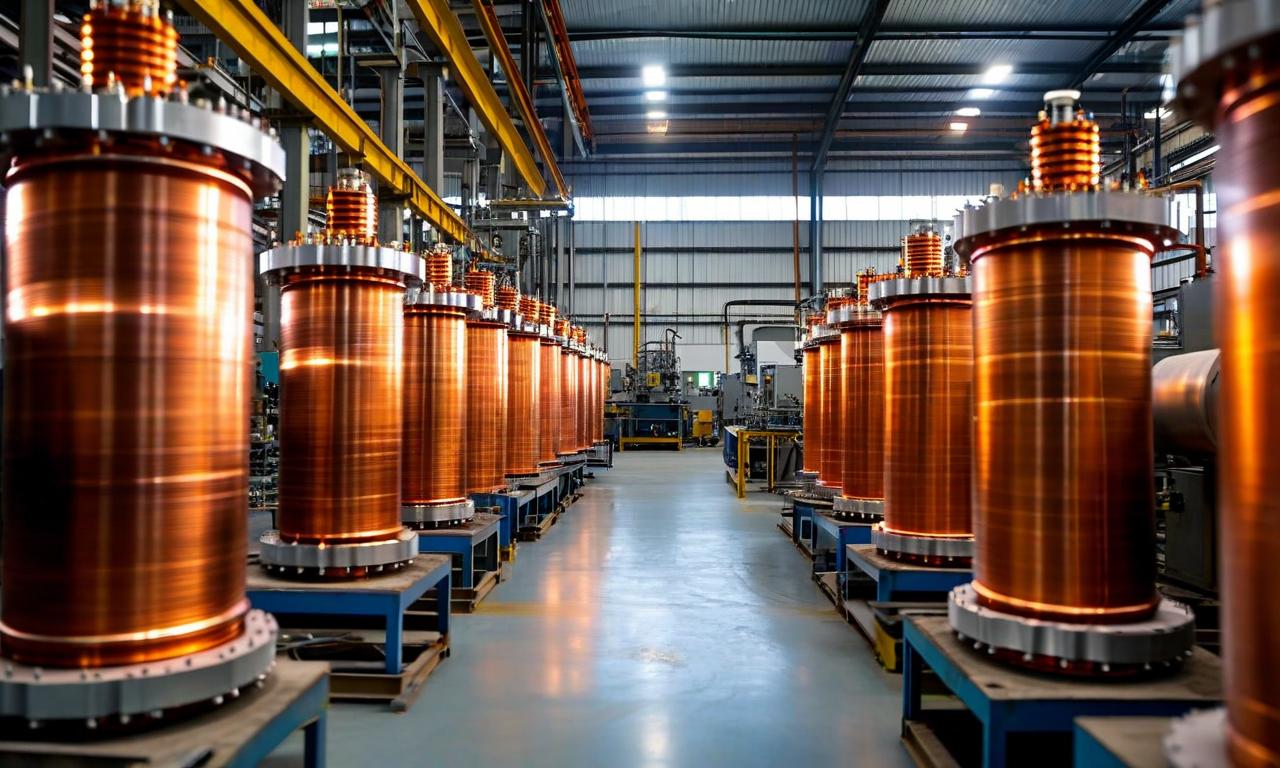
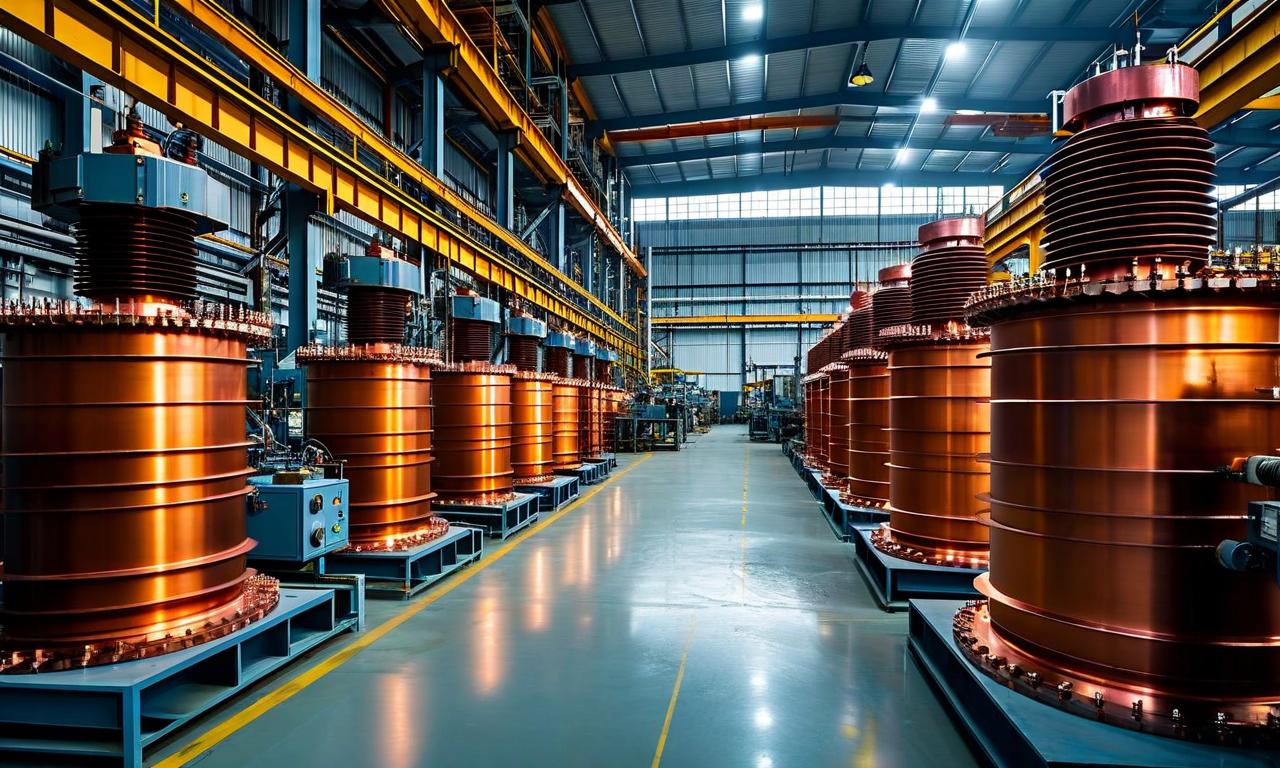
*this image is generated using AI for illustrative purposes only.
Transformers & Rectifiers India Limited faces significant downside pressure as InCred has cut its target price by 33.33% to ₹200 per share, despite the company reporting strong quarterly results. The brokerage firm has maintained a 'Reduce' rating, citing multiple near-term challenges that could impact growth visibility and execution outlook.
Brokerage Downgrade Details
InCred's revised target price represents a substantial downside potential of 31.47% from the previous day's closing price of ₹291.85. The shares were trading at ₹286.45, down 1.85% from the previous close, with a market capitalization of ₹8,590.75 crore.
| Parameter: | Details |
|---|---|
| Previous Target Price: | ₹300 |
| Revised Target Price: | ₹200 |
| Downside Potential: | 31.47% |
| Current Rating: | Reduce |
| Market Cap: | ₹8,590.75 crore |
Key Concerns Driving Downgrade
The brokerage highlighted several factors contributing to their cautious stance:
- Order Intake Decline: 19% year-on-year decrease in order intake during 9M FY26
- Stagnant Order Backlog: Remained largely flat over the last three quarters
- Leadership Transition: CEO Mukul Srivastava's resignation on January 7, 2026, due to personal reasons
- Execution Uncertainty: Near-term challenges affecting growth visibility
The order backlog progression shows minimal growth, standing at ₹5,246 crore in June 2025, increasing marginally to ₹5,472 crore by September 2025, and slightly decreasing to ₹5,450 crore by December 2025.
Strong Q3 FY26 Financial Performance
Despite the brokerage concerns, Transformers & Rectifiers India Limited delivered robust quarterly results:
| Metric: | Q3 FY26 | Q3 FY25 | YoY Growth | Q2 FY26 | QoQ Growth |
|---|---|---|---|---|---|
| Revenue: | ₹736.76 cr | ₹559.36 cr | +31.71% | ₹460.03 cr | +60.15% |
| Net Profit: | ₹75.97 cr | ₹55.48 cr | +36.93% | ₹37.35 cr | +103.40% |
The consolidated revenue from operations increased significantly, demonstrating strong operational performance across both year-on-year and quarter-on-quarter comparisons.
Order Book and Strategic Developments
As of December 2025, the company maintains a substantial order book with ₹5,450 crore of unexecuted orders and ₹665 crore of new order inflows. A significant strategic milestone was achieved with the company's entry into the HVDC transformer segment.
The company has inquiries worth over ₹16,500 crore currently under negotiation, indicating potential future growth opportunities. The diverse product portfolio includes single-phase power transformers up to 500 MVA and 1200 kV class, furnace transformers, rectifier and distribution transformers, and specialty transformers for various applications.
Company Profile and Performance Metrics
Established in 1994 and headquartered in Ahmedabad, Transformers & Rectifiers India Limited operates as a leading manufacturer of transformers and reactors. The company serves a diversified customer base including Power Grid, NTPC, Adani Renewables, Tata Power, JSW, ReNew Power, Siemens Energy, GE, SAIL, Blue Star, and Jindal Group.
| Financial Metric: | Value |
|---|---|
| Revenue CAGR (5-year): | 23.54% |
| Net Profit CAGR (5-year): | 193.02% |
| ROCE: | 28.00% |
| ROE: | 23.40% |
| EPS: | ₹8.97 |
| Debt-to-Equity Ratio: | 0.27x |
| Manufacturing Capacity: | 40,000 MVA |
| Export Presence: | 25+ countries |
The company's strong financial metrics reflect its operational efficiency and growth trajectory over the past five years, despite current near-term challenges highlighted by the brokerage downgrade.
Historical Stock Returns for Transformers & Rectifiers
| 1 Day | 5 Days | 1 Month | 6 Months | 1 Year | 5 Years |
|---|---|---|---|---|---|
| -0.05% | -8.97% | -12.66% | +26.89% | -39.46% | +1,695.32% |
 15
15