NewsPolyplex Corporation Reports Mixed Q3 FY26 Performance with Consolidated Profit Despite Standalone Loss
Polyplex Corporation Reports Mixed Q3 FY26 Performance with Consolidated Profit Despite Standalone Loss


Polyplex Corporation Limited reported mixed Q3 FY26 results with standalone operations recording a loss of ₹770 lakh against a profit of ₹1,919 lakh in the previous year, while consolidated operations showed resilience with a profit of ₹2,961 lakh. Standalone revenue declined 18.3% to ₹33,117 lakh, whereas consolidated revenue decreased marginally by 2.3% to ₹168,243 lakh. The results were approved by the Board of Directors on February 13, 2026.

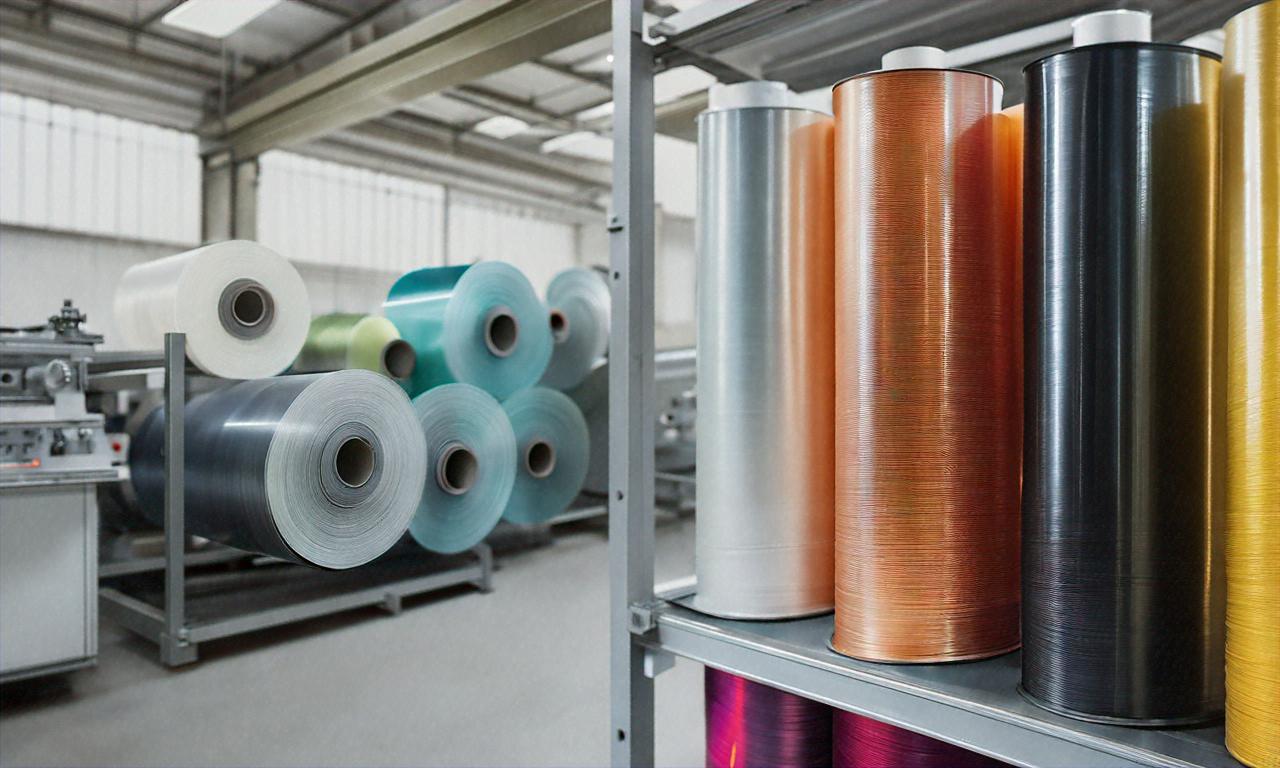
*this image is generated using AI for illustrative purposes only.
Polyplex Corporation Limited announced its unaudited financial results for the quarter and nine months ended December 31, 2025, showcasing contrasting performance between standalone and consolidated operations. The polymeric films manufacturer's results were approved by the Board of Directors on February 13, 2026, following audit committee recommendations.
Standalone Financial Performance
The company's standalone operations faced challenges during Q3 FY26, reporting a significant decline in financial performance compared to the previous year.
| Metric | Q3 FY26 | Q3 FY25 | Change |
|---|---|---|---|
| Revenue from Operations | ₹33,117 lakh | ₹40,538 lakh | -18.3% |
| Total Income | ₹33,771 lakh | ₹41,686 lakh | -19.0% |
| Net Profit/(Loss) | (₹770 lakh) | ₹1,919 lakh | Loss |
| Basic EPS | (₹2.46) | ₹6.12 | Negative |
For the nine months ended December 31, 2025, standalone revenue from operations declined to ₹109,571 lakh from ₹118,068 lakh in the corresponding period of the previous year. Despite the quarterly loss, the company maintained profitability for the nine-month period with a net profit of ₹3,052 lakh compared to ₹4,042 lakh in the previous year.
Consolidated Operations Show Resilience
The consolidated financial results presented a more positive picture, demonstrating the strength of the company's global operations and diversified portfolio.
| Metric | Q3 FY26 | Q3 FY25 | Change |
|---|---|---|---|
| Revenue from Operations | ₹168,243 lakh | ₹172,116 lakh | -2.3% |
| Total Income | ₹170,969 lakh | ₹182,861 lakh | -6.5% |
| Net Profit | ₹2,961 lakh | ₹10,513 lakh | -71.8% |
| Basic EPS | ₹4.70 | ₹18.40 | -74.5% |
The consolidated nine-month performance showed revenue from operations of ₹521,514 lakh compared to ₹514,562 lakh in the previous year, representing a marginal increase. However, net profit for the nine-month period declined significantly to ₹330 lakh from ₹36,637 lakh in the corresponding period of FY25.
Operational Highlights and Challenges
The company's cost structure reflected mixed trends across different expense categories. Material costs remained the largest component, accounting for ₹102,159 lakh in consolidated operations for Q3 FY26. Employee benefit expenses increased to ₹19,978 lakh from ₹15,852 lakh in the corresponding quarter of the previous year, indicating expansion in workforce or wage adjustments.
Other comprehensive income showed significant volatility, with exchange differences on translation of foreign operations contributing ₹8,340 lakh to other comprehensive income during the quarter. This reflects the impact of currency fluctuations on the company's international operations.
Corporate Developments
The company's financial results include several noteworthy corporate developments. The board of directors of a subsidiary company approved the dissolution of PAR LLC during the quarter, with all assets and liabilities recorded at realizable value. The management indicated this dissolution would not have a material impact on the group's consolidated financial statements.
Additionally, the company continues to monitor the implementation of four new Labour Codes notified by the Government of India in November 2025, though the impact on financial results is assessed as not material for the current reporting period.
Segment and Geographic Focus
Polyplex Corporation operates primarily in the polymeric films manufacturing segment, which management views as a single reportable business segment. The company's operations span multiple geographies through its subsidiary network, including entities in Thailand, Singapore, Netherlands, Turkey, Indonesia, and the USA, providing geographic diversification to its revenue streams.
Historical Stock Returns for Polyplex Corporation
| 1 Day | 5 Days | 1 Month | 6 Months | 1 Year | 5 Years |
|---|---|---|---|---|---|
| -1.77% | +6.14% | +17.74% | +38.90% | +3.14% | -23.02% |
 16
16