Procter & Gamble Hygiene and Health Care Limited Announces Q2 FY2026 Financial Results


P&G Hygiene and Health Care Ltd (PGHH) announced Q2 FY2026 results with revenue increasing by 1% to ₹1,150.00 crore. However, EBITDA decreased by 5.71% to ₹330.00 crore, and net profit slightly declined by 0.94% to ₹210.00 crore compared to Q2 FY2025. The company maintains a strong financial position with ₹782.10 crore in cash and cash equivalents. PGHH operates in two main segments: Health Care Products and Hygiene Products.


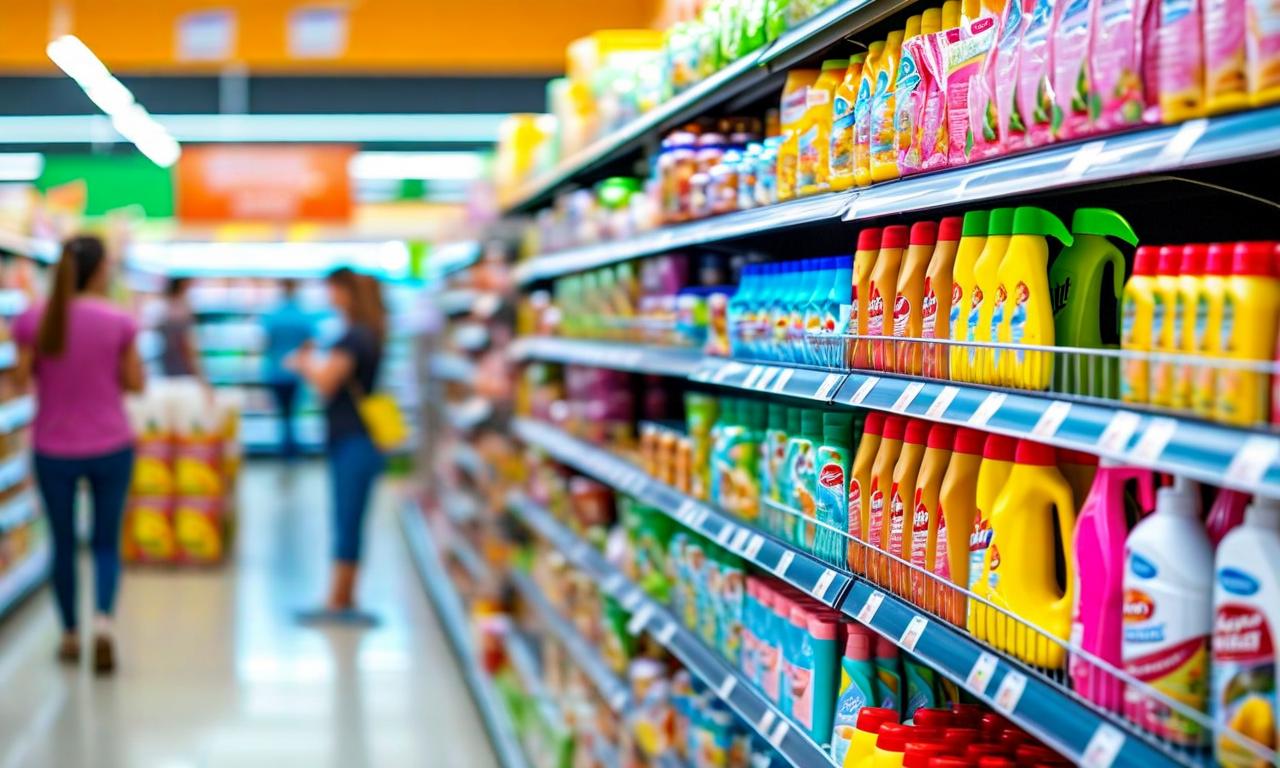
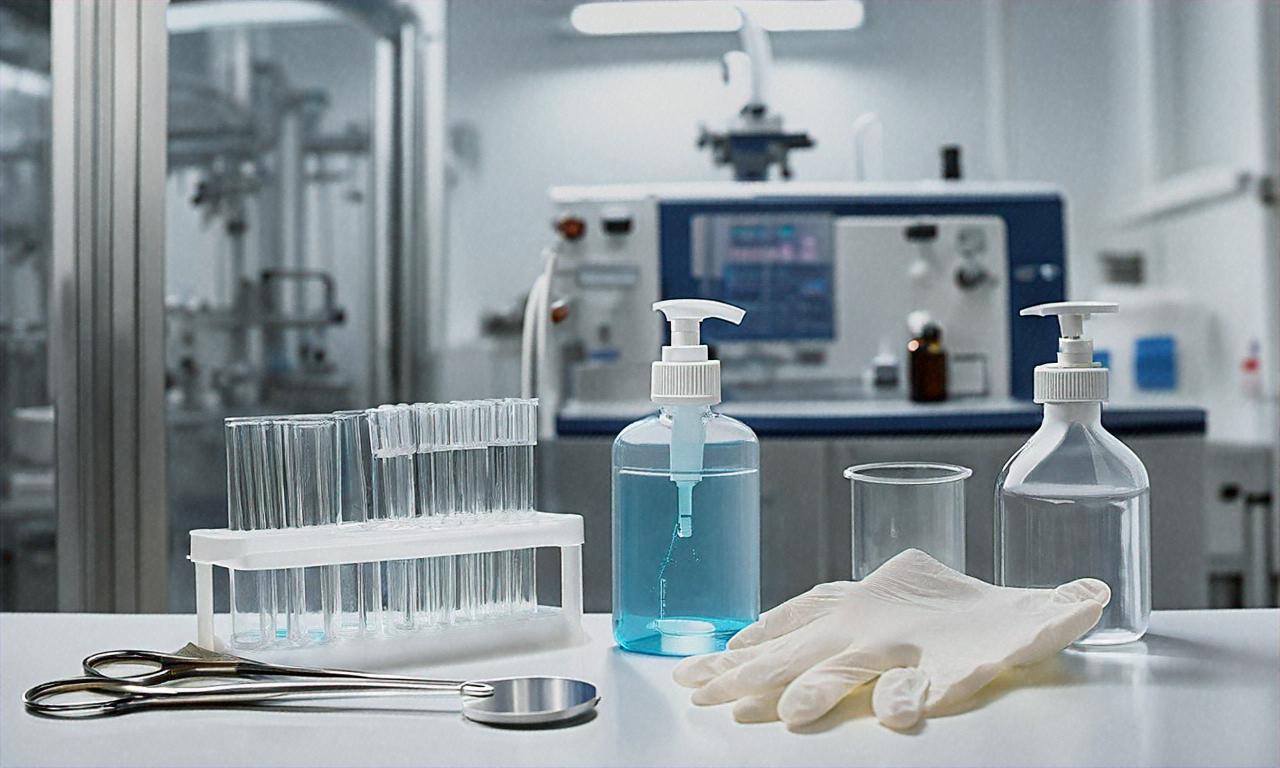
*this image is generated using AI for illustrative purposes only.
P&G Hygiene and Health Care Ltd (PGHH) has announced its unaudited financial results for the quarter ended September 30, 2025, revealing the company's performance in its two main segments: Health Care Products and Hygiene Products.
Financial Results Overview
The Board of Directors approved the results at a meeting held on November 6, 2025. Key financial highlights include:
| Metric | Q2 FY2026 | Q2 FY2025 | Change |
|---|---|---|---|
| Revenue | ₹1,150.00 crore | ₹1,135.00 crore | +1.00% |
| EBITDA | ₹330.00 crore | ₹350.00 crore | -5.71% |
| EBITDA Margin | 28.67% | 30.75% | -2.08% |
| Net Profit | ₹210.00 crore | ₹212.00 crore | -0.94% |
Segment Operations
PGHH operates in two main segments:
- Health Care Products: Comprising ointments, creams, cough drops, and tablets
- Hygiene Products: Including feminine hygiene products and other skin care hygiene items
Financial Position
As of September 30, 2025, PGHH's financial position remains strong:
- Cash and Cash Equivalents: ₹782.10 crore
- Total Assets: ₹2,133.41 crore
- Total Equity: ₹931.27 crore
Audit and Review
The financial results were reviewed by the Audit Committee and have been subject to limited review by statutory auditors.
Change in Financial Year
The company changed its financial year from June 30 to March 31, with the previous financial year 2024-25 covering nine months from July 1, 2024, to March 31, 2025.
Investors and stakeholders may closely monitor how PGHH navigates market conditions in the coming quarters, balancing revenue growth with profitability and operational efficiency across its key product categories.
Historical Stock Returns for P&G Hygiene and Health Care
| 1 Day | 5 Days | 1 Month | 6 Months | 1 Year | 5 Years |
|---|---|---|---|---|---|
| -0.47% | -1.83% | -1.74% | -28.38% | -32.91% | -31.85% |
 20
20