Kuantum Papers Reports 25.5% Sequential Revenue Growth Amid Margin Pressure in Q2 FY26


Kuantum Papers Limited achieved a 25.5% sequential growth in operational income, reaching Rs. 280.00 crores in Q2 FY26. The company set new production records, including a monthly high of 8,303 metric tons. However, EBITDA margins contracted to 12.3% due to higher raw material costs and GST changes. Net sales realization decreased by Rs. 3,200.00 per ton, while production costs rose by Rs. 1,300.00 per ton. In response to market challenges, Kuantum Papers is shifting focus to higher value-added products and plans to expand capacity from 450 to 650 tons per day, targeting 30-40% volume growth in FY27.


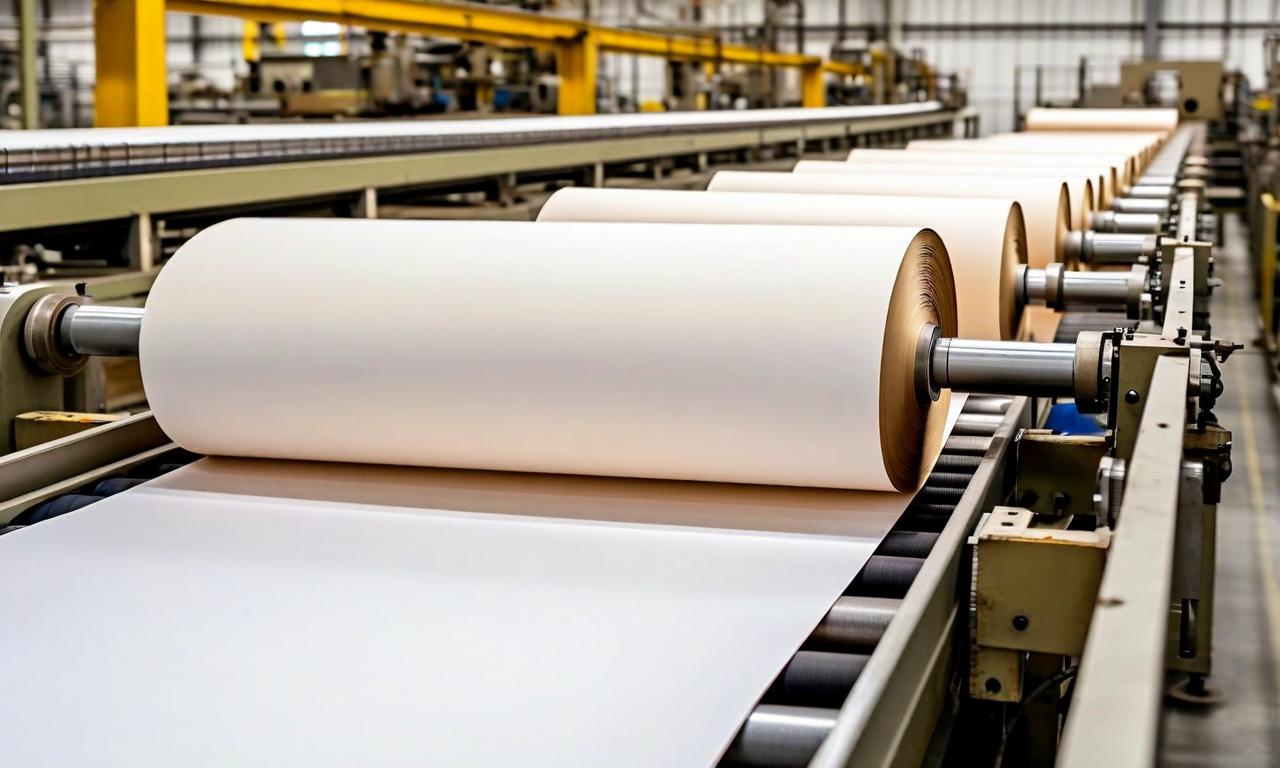
*this image is generated using AI for illustrative purposes only.
Kuantum Papers Limited , a key player in the Indian paper industry, has reported a significant 25.5% sequential growth in operational income for Q2 FY26, despite facing challenges in maintaining profit margins. The company's performance reflects both its strategic initiatives and the impact of external factors on its operations.
Revenue Growth and Production Milestones
Kuantum Papers achieved an operational income of Rs. 280.00 crores in Q2 FY26, marking a substantial increase from the previous quarter. This growth was primarily driven by higher paper production following the upgradation of paper machine 4. The company reached new production milestones, including:
- Highest ever monthly production of 8,303 metric tons in September
- Highest daily production of 360 tons in July 2025
These achievements underscore the company's efforts to enhance its production capabilities and meet market demand.
Margin Pressure and Challenges
Despite the impressive revenue growth, Kuantum Papers faced significant margin pressure during the quarter:
- EBITDA margins contracted to 12.3% from the previous quarter
- Net sales realization declined by Rs. 3,200.00 per ton
- Production costs increased by Rs. 1,300.00 per ton
The margin contraction was largely attributed to higher agro and wood-based raw material prices, exacerbated by floods in Punjab. Additionally, the company is grappling with challenges arising from recent GST rate changes, which have created an inverted duty structure in the paper industry.
GST Impact and Strategic Shift
The recent changes in GST rates have introduced complexities for Kuantum Papers:
- Paper and boards: GST increased from 12% to 18%
- Converted products: GST reduced to 5%
- Notebooks: Made nil-rated
In response to these changes and market dynamics, Kuantum Papers is strategically moving away from the notebook segment. Instead, the company is focusing on higher value-added Maplitho grades and specialty papers, aiming to optimize its product mix and profitability.
Future Outlook and Expansion Plans
Kuantum Papers has outlined plans for growth and margin improvement:
- Capacity expansion: From current 450 tons per day to 650 tons per day
- Target volume growth: 30-40% in FY27
- Expected EBITDA margins: 18-20% post-expansion
Management expects these initiatives to boost the company's performance and profitability in the coming years.
Financial Performance Overview
To provide a clearer picture of Kuantum Papers' financial performance, here's a comparison of key metrics for Q2 FY26 against the previous quarter:
| Metric | Q2 FY26 | Q1 FY26 | Change |
|---|---|---|---|
| Revenue (Rs. crore) | 281.90 | 224.40 | +25.62% |
| EBITDA (Rs. crore) | 36.50 | 41.80 | -12.68% |
| Net Profit (Rs. crore) | 5.80 | 12.10 | -52.07% |
| EPS (Rs.) | 0.66 | 1.38 | -52.17% |
The table highlights the company's strong revenue growth, but also illustrates the significant impact on profitability due to the challenges faced during the quarter.
In conclusion, while Kuantum Papers has demonstrated robust growth in production and revenue, it faces near-term challenges in maintaining profitability. The company's strategic shift towards higher-value products and its capacity expansion plans indicate a focus on long-term growth and margin improvement.
Historical Stock Returns for Kuantum Papers
| 1 Day | 5 Days | 1 Month | 6 Months | 1 Year | 5 Years |
|---|---|---|---|---|---|
| +6.84% | +8.34% | +6.41% | -6.24% | -37.74% | -1.08% |
 19
19