NewsGreenply Industries Q3FY26 Earnings Call: Management Discusses Growth Strategy and Expansion Plans
Greenply Industries Q3FY26 Earnings Call: Management Discusses Growth Strategy and Expansion Plans


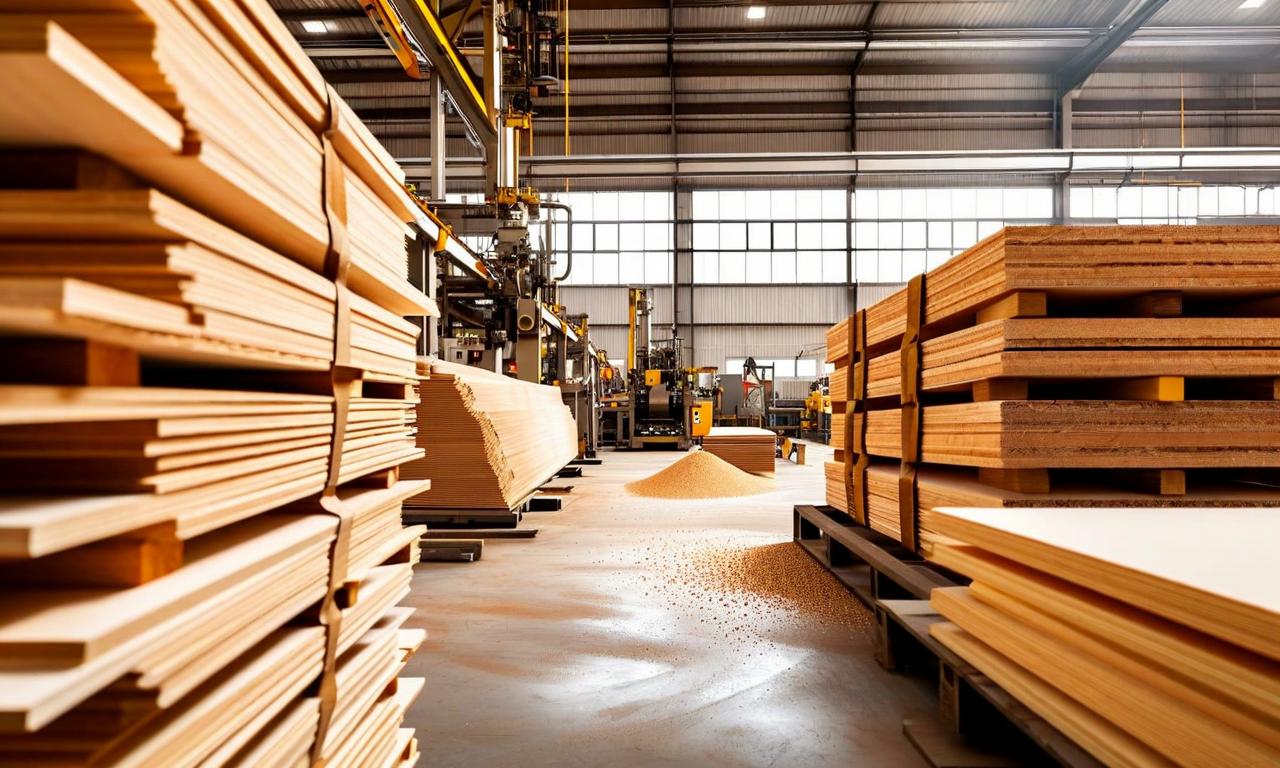
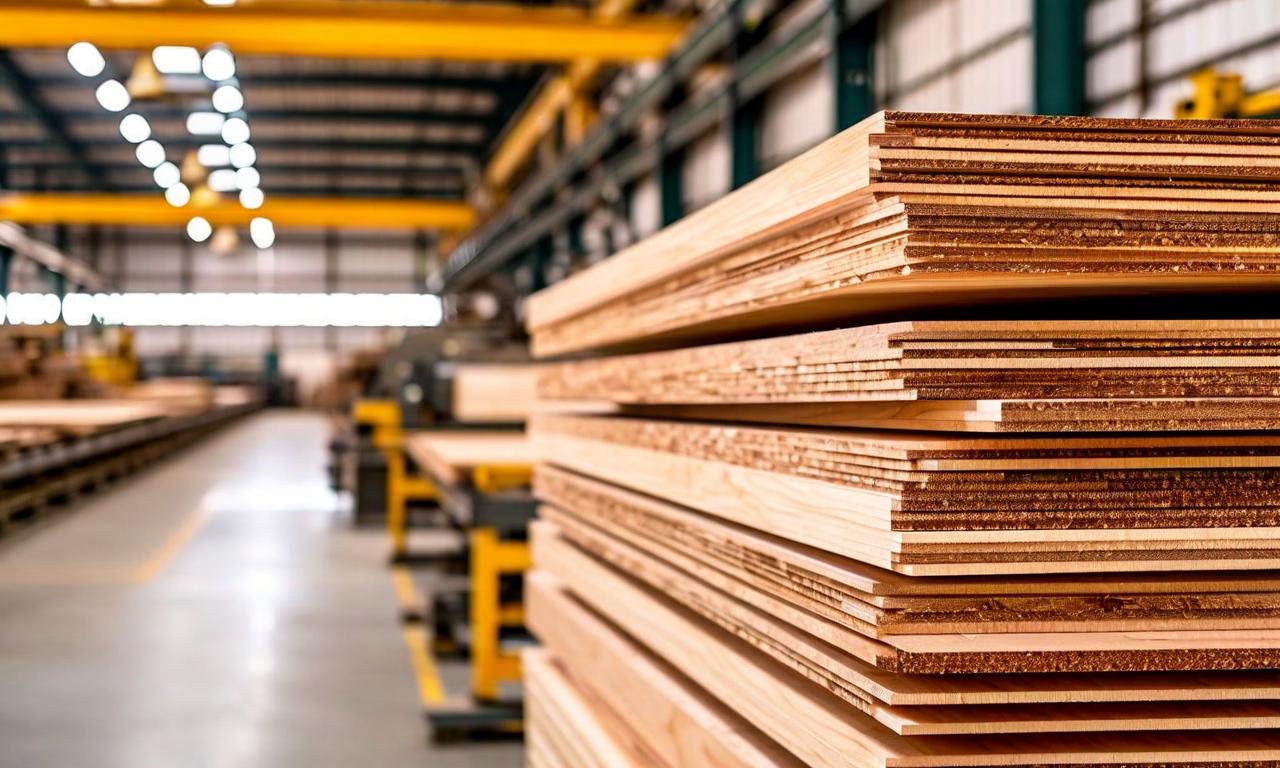
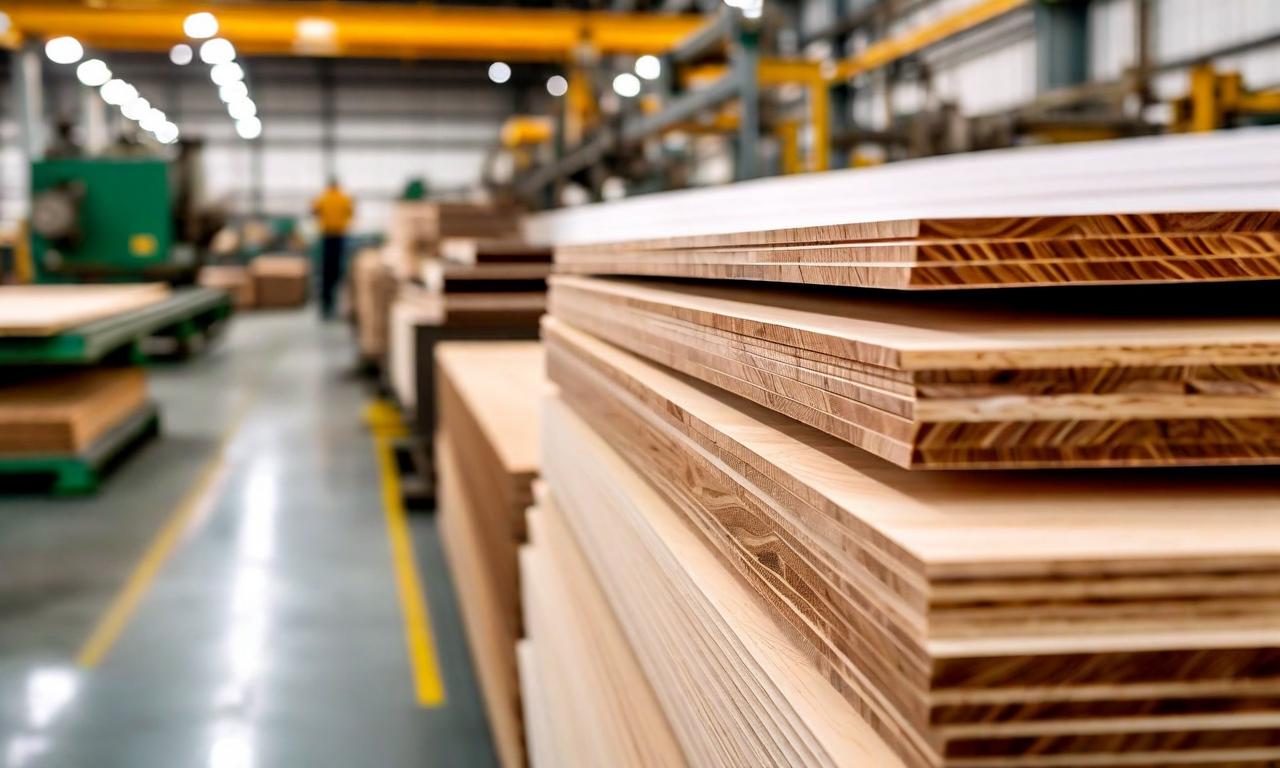
Greenply Industries conducted its Q3FY26 earnings conference call where management presented consolidated revenue growth of 9.6% to ₹673.4 crores and announced major expansion plans including a ₹425 crore MDF capacity addition. The company achieved double-digit volume growth in both plywood (12.5%) and MDF (14.5%) segments, with management expressing confidence in sustaining growth momentum through improved distribution strategies and operational efficiencies.
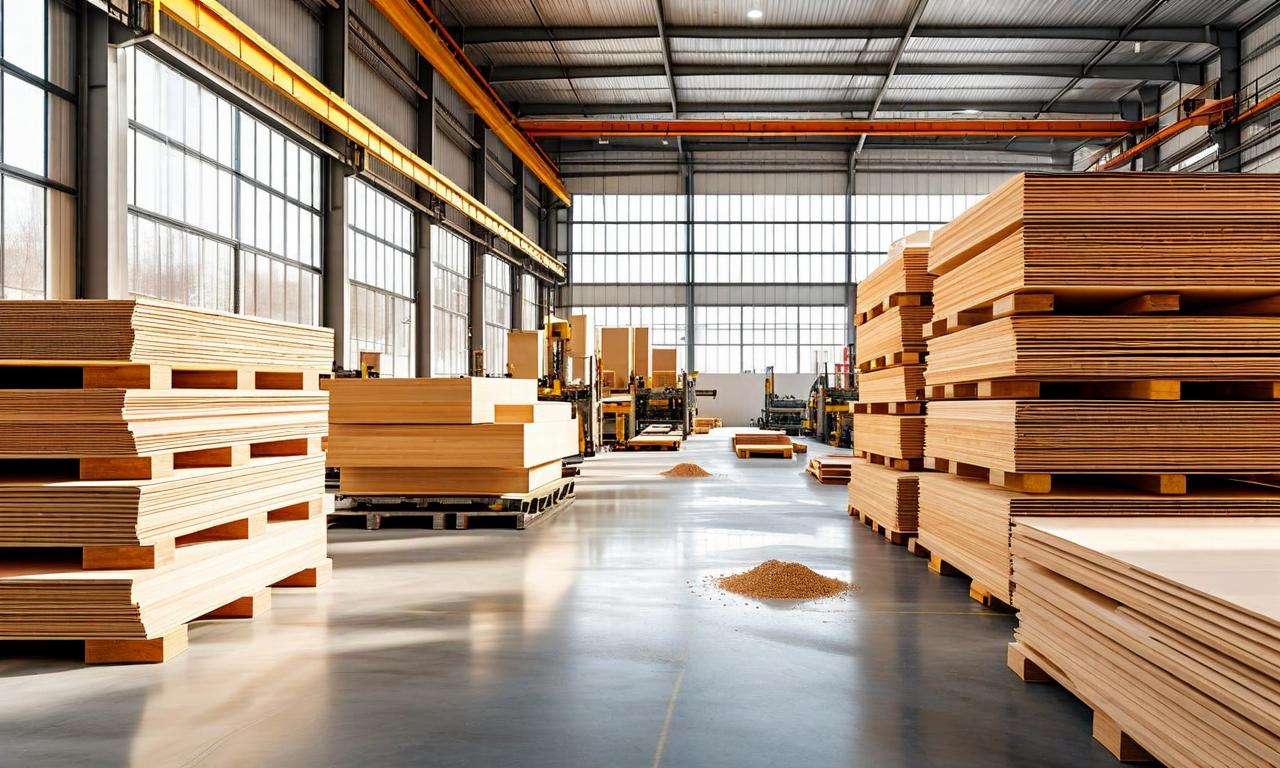

*this image is generated using AI for illustrative purposes only.
Greenply Industries Limited held its Q3FY26 earnings conference call on February 5, 2026, where management discussed the company's financial performance, strategic initiatives, and future growth plans. The call was hosted by Asian Market Securities and featured key executives including Joint Managing Directors Manoj Tulsian and Sanidhya Mittal, along with CFO Sanjiv Keshri.
Financial Performance Highlights
During the conference call, management presented the consolidated financial results for Q3FY26, demonstrating mixed performance with strong revenue growth offset by margin pressures.
| Financial Metric: | Q3FY26 | Q3FY25 | Change |
|---|---|---|---|
| Consolidated Revenue: | ₹673.4 crores | ₹614.45 crores | +9.6% YoY |
| Core EBITDA: | ₹58.9 crores | ₹54.0 crores | +9.07% YoY |
| Core EBITDA Margin: | 8.7% | 8.8% | -10 bps |
| Nine-Month Revenue: | ₹1,962.8 crores | ₹1,838.81 crores | +6.7% YoY |
Business Segment Performance
Management highlighted double-digit volume growth across both plywood and MDF segments, with the plywood business achieving 12.5% volume growth year-on-year despite average realization declining to ₹244 per square meter.
| Business Segment: | Q3FY26 Performance | Growth Rate |
|---|---|---|
| Plywood Volume Growth: | 12.5% YoY | Double-digit |
| MDF Volume Growth: | 14.5% YoY | Double-digit |
| MDF Revenue: | ₹152 crores | +11.7% YoY |
| MDF Volume: | 48,383 CBM | +14.5% YoY |
Strategic Expansion Plans
A significant portion of the call focused on the company's expansion strategy, particularly the board-approved MDF capacity expansion at the Vadodara facility.
| Expansion Details: | Specifications |
|---|---|
| New MDF Capacity: | 600-700 CBM per day |
| Investment Amount: | ₹425 crores |
| Expected Commission: | Q2 FY2028 |
| Revenue Potential: | ₹600 crores |
| Technology: | German 8-feet wide continuous line |
Management Commentary on Growth Strategy
CEO Manoj Tulsian emphasized the company's three-brand communication strategy and its positive impact on market performance. He noted that the company has implemented significant operational improvements over the past 18 months, including enhanced distribution reach, sales force automation, and strategic focus on the mid-segment Ecotec brand.
Tulsian stated, "We are confident of sustaining this momentum in quarter 4 FY '26 and in the periods ahead," highlighting the company's expectation of continued double-digit volume growth.
Operational Challenges and Recovery
Sanidhya Mittal, Joint Managing Director, addressed the MDF business challenges during Q3FY26, explaining that initial production issues in October and November impacted margins. However, he confirmed that January production reached the highest-ever levels, with operations now fully stabilized.
Debt Management and Future Financing
CFO Sanjiv Keshri discussed the company's debt management strategy, confirming that the debt-to-equity ratio will remain within the guided range of 0.5x to 0.6x. The management indicated that the new MDF expansion will be financed through a mix of borrowings and internal accruals, with strong cash generation expected to support both existing debt servicing and new investments.
Other Business Updates
The call also covered updates on the Furniture and Fitting JV, which reported sales of ₹13.4 crores in Q3FY26, and progress on the Odisha plywood facility construction, which remains on track for commissioning in Q4 FY2027. Management also noted the continued reduction in Middle East exposure from USD 2.7 million to USD 1 million.
Historical Stock Returns for Greenply Industries
| 1 Day | 5 Days | 1 Month | 6 Months | 1 Year | 5 Years |
|---|---|---|---|---|---|
| +2.00% | +5.59% | +11.58% | +45.38% | +0.93% | +69.53% |
 15
15