Enkei Wheels India Q3 Profit Surges to ₹42M with Strong Revenue Growth


Enkei Wheels India delivered outstanding Q3 performance with remarkable turnaround from ₹30M loss to ₹42M profit, accompanied by strong revenue growth of 28.21% to ₹2.5 billion and significant EBITDA margin improvement to 10.07%. The company's annual FY25 results showed robust performance with 15.10% revenue growth and 93.31% net profit surge, demonstrating effective operational strategies and strong market positioning in the automotive wheels segment.


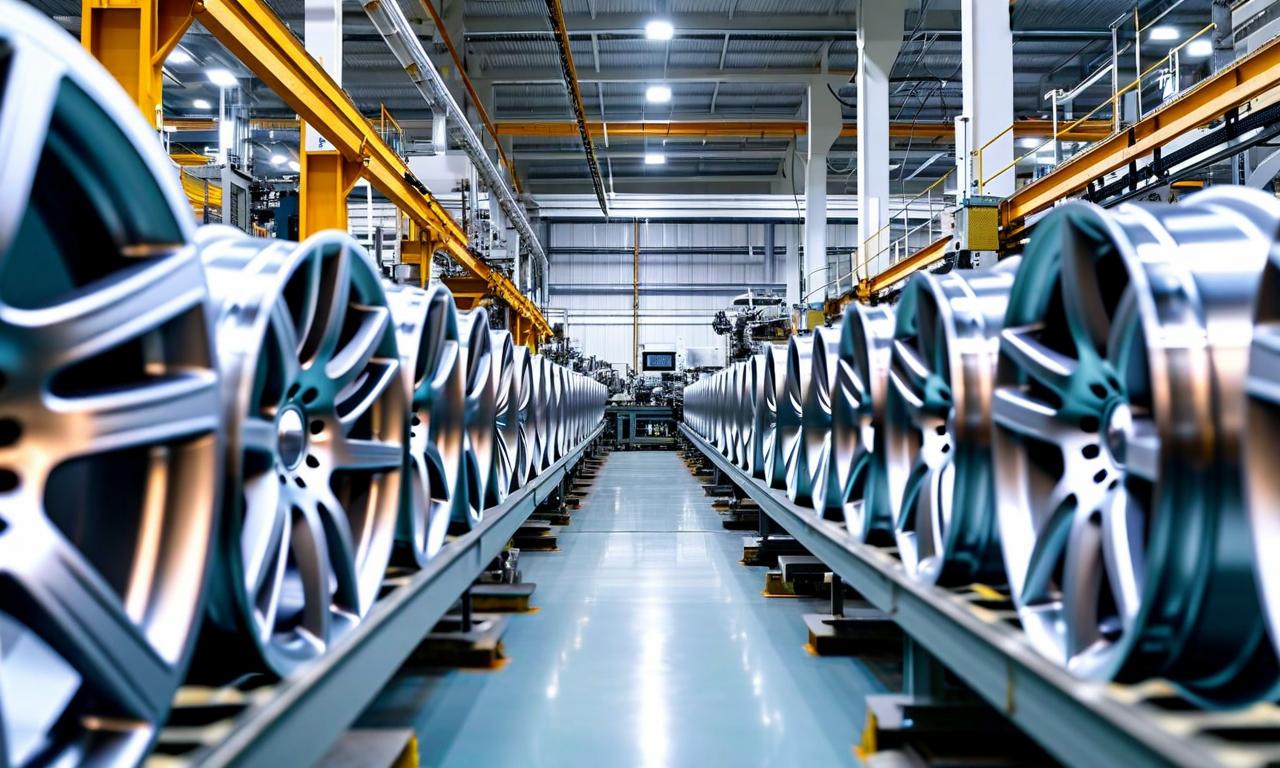
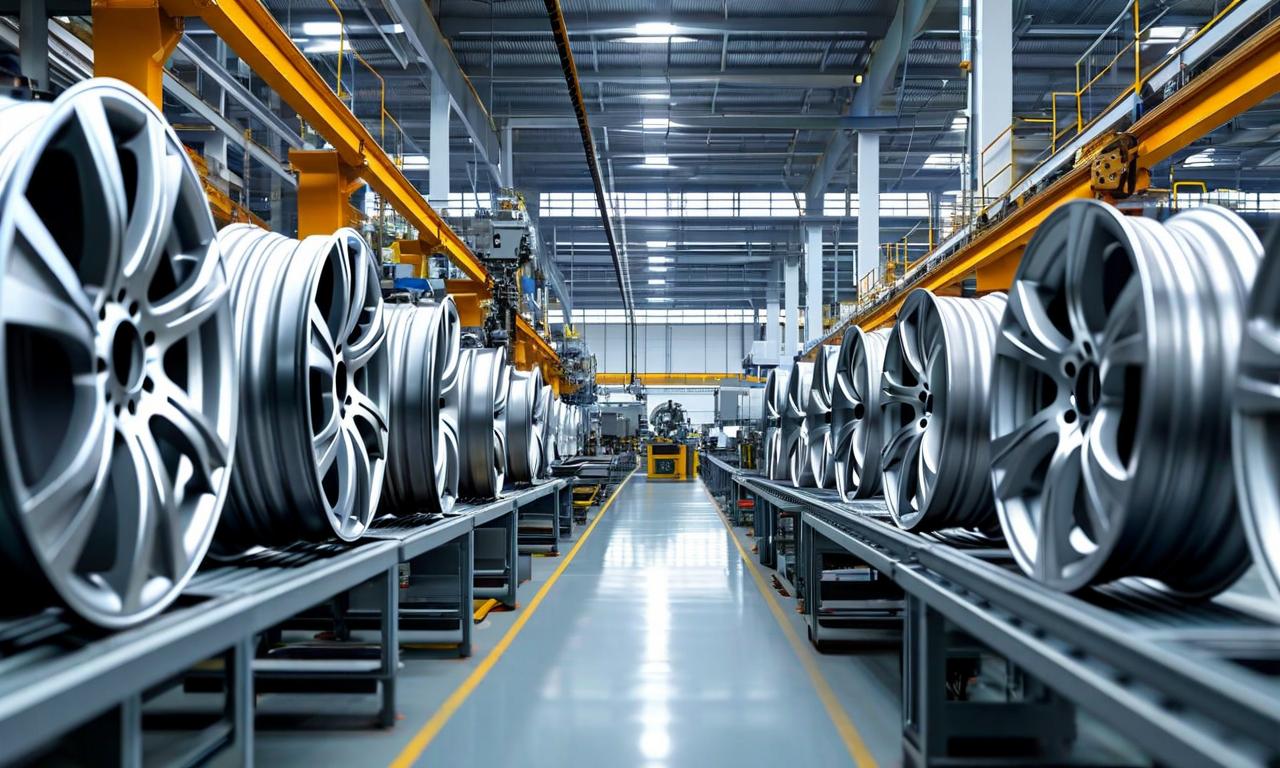
*this image is generated using AI for illustrative purposes only.
Enkei Wheels (India) Limited has announced its audited financial results for the year ended December 31, 2025, under Regulation 33 of SEBI (Listing Obligations and Disclosure Requirements) Regulations, 2015. The automotive wheels manufacturer delivered exceptional performance with significant improvements across all key financial metrics, demonstrating strong operational recovery and market positioning.
Outstanding Q3 Performance Turnaround
The third quarter results demonstrated remarkable operational turnaround with the company achieving strong profitability and margin expansion. The quarter showcased significant improvement in operational efficiency and market demand recovery, marking a complete reversal from the previous year's loss position.
| Q3 Performance Metrics: | Q3 Current Year | Q3 Previous Year | Change |
|---|---|---|---|
| Revenue: | ₹2.50 billion | ₹1.95 billion | +28.21% |
| Net Profit/(Loss): | ₹42 million | Loss ₹30 million | Positive turnaround |
| EBITDA: | ₹247 million | ₹74 million | +233.78% |
| EBITDA Margin: | 10.07% | 3.79% | +6.28 percentage points |
Strong Annual Financial Performance
The company achieved remarkable growth in both revenue and profitability during FY25. The audited results showcase the effectiveness of operational strategies and improved market demand in the automotive wheels segment.
| Financial Metric: | FY25 (₹ million) | FY24 (₹ million) | Growth (%) |
|---|---|---|---|
| Revenue from Operations: | 9,716.29 | 8,441.53 | +15.10% |
| Total Revenue: | 9,741.64 | 8,503.17 | +14.56% |
| Net Profit: | 51.34 | 26.56 | +93.31% |
| Earnings Per Share (Basic): | 2.86 | 1.48 | +93.24% |
Fourth Quarter Performance Highlights
The fourth quarter performance demonstrated continued improvement compared to the corresponding period last year. The company successfully maintained profitability momentum established in the third quarter.
| Quarter Metrics: | Q4 FY25 (₹ million) | Q4 FY24 (₹ million) | Change |
|---|---|---|---|
| Revenue from Operations: | 2,453.78 | 1,952.00 | +25.70% |
| Net Profit/(Loss): | 42.07 | (29.67) | Positive turnaround |
| Earnings Per Share: | 2.34 | (1.65) | Positive turnaround |
Impact of New Labour Codes
The company recorded exceptional items of ₹45.84 million during FY25, primarily related to compliance with new Labour Codes. This impact arose from the Government of India's notification of four Labour Codes on November 21, 2025, consolidating 29 existing labour laws. The incremental employee benefits cost primarily resulted from changes in wage definitions under the new regulations.
Strong Balance Sheet and Corporate Governance
The company maintained robust financial health with total assets increasing to ₹6,050.26 million as of December 31, 2025, compared to ₹5,637.48 million in the previous year. Shareholders' equity strengthened to ₹2,396.63 million from ₹2,354.34 million, reflecting improved retained earnings and financial stability.
| Corporate Decision: | Details |
|---|---|
| Annual General Meeting: | Scheduled for April 16, 2026 |
| Internal Auditor: | Re-appointment of Mr. Mrugendra Mandke from Mandke and Associate for FY26 |
| Senior Leadership: | Ratification of Mr. Sandeep Ohol's appointment as Senior Vice President |
| Audit Opinion: | Unmodified opinion issued by Kirtane & Pandit LLP |
The statutory auditors Kirtane & Pandit LLP issued an unmodified audit opinion on the financial statements, confirming the accuracy and compliance of the reported results with applicable accounting standards and regulatory requirements.
Historical Stock Returns for Enkei Wheels
| 1 Day | 5 Days | 1 Month | 6 Months | 1 Year | 5 Years |
|---|---|---|---|---|---|
| -0.18% | -0.23% | -9.29% | -18.69% | -30.49% | -8.33% |
 18
18