NewsAI Champdany Industries Reports Q3FY26 Results with Reduced Losses Despite Operational Challenges
AI Champdany Industries Reports Q3FY26 Results with Reduced Losses Despite Operational Challenges


AI Champdany Industries Limited reported improved Q3FY26 results with net loss reducing to Rs 592.47 lacs from Rs 2,056.07 lacs in Q3FY25, while revenue increased 63.1% to Rs 4,175.17 lacs. Nine-month performance showed revenue growth of 143.6% to Rs 14,134.15 lacs and reduced net loss to Rs 2,015.72 lacs from Rs 4,321.44 lacs. The company faces operational challenges including suspended units due to labour issues and market volatility from raw material shortages and Bangladesh's jute export ban.

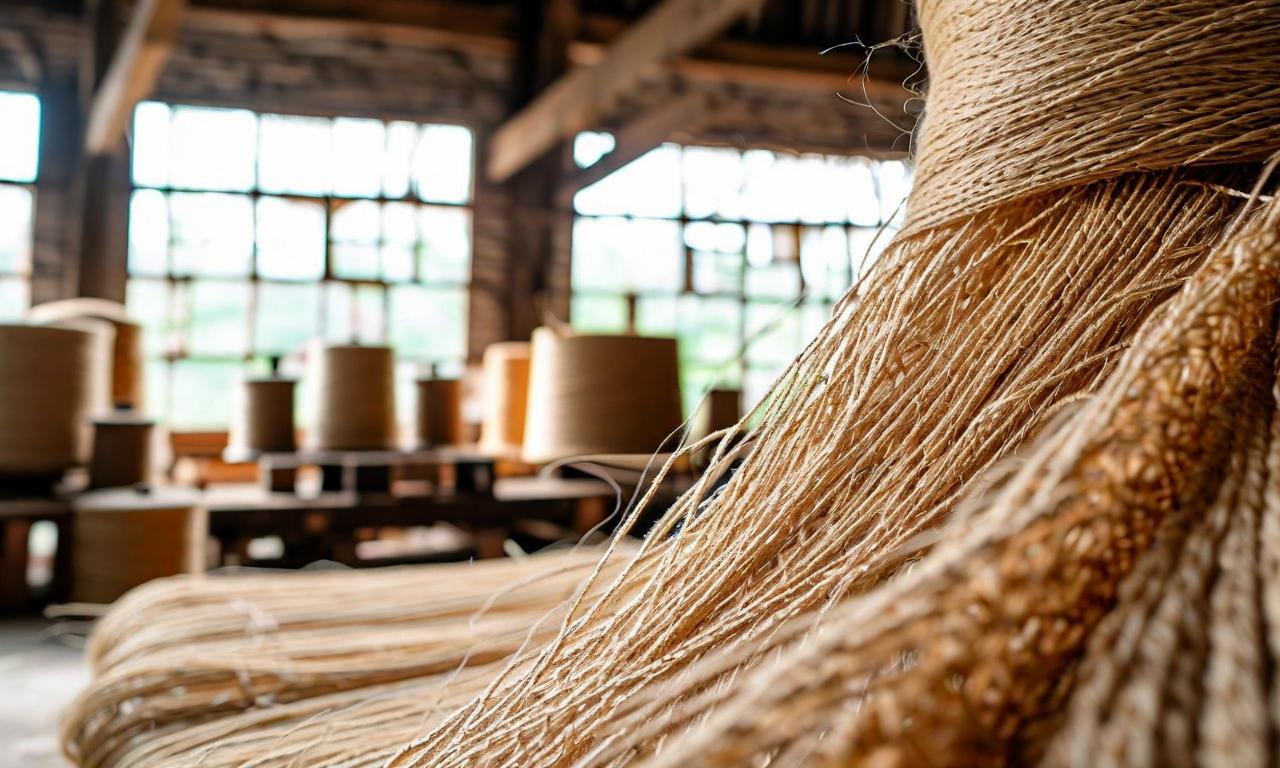
*this image is generated using AI for illustrative purposes only.
AI Champdany Industries Limited has announced its unaudited financial results for the quarter ended December 31, 2025, showing improved performance despite ongoing operational challenges. The textile manufacturer, established in 1873 as a pioneer in natural and synthetic blended fabrics and yarns, reported significantly reduced losses compared to the previous year.
Financial Performance Overview
The company's financial performance for Q3FY26 demonstrated notable improvement across key metrics:
| Metric | Q3FY26 | Q3FY25 | Change |
|---|---|---|---|
| Revenue from Operations | Rs 4,175.17 lacs | Rs 2,559.40 lacs | +63.1% |
| Net Loss | Rs 592.47 lacs | Rs 2,056.07 lacs | -71.2% |
| Total Income | Rs 4,182.85 lacs | Rs 2,630.82 lacs | +59.0% |
| Total Expenses | Rs 4,778.67 lacs | Rs 4,657.00 lacs | +2.6% |
For the nine-month period ended December 31, 2025, the company showed substantial improvement with revenue from operations reaching Rs 14,134.15 lacs compared to Rs 5,802.32 lacs in the corresponding period of FY25, representing a growth of 143.6%. The nine-month net loss reduced to Rs 2,015.72 lacs from Rs 4,321.44 lacs in the previous year.
Segment-wise Performance
The company operates through two primary business segments:
| Segment | Q3FY26 Revenue | Q3FY25 Revenue | Nine-Month FY26 |
|---|---|---|---|
| Jute/Jute Diversified Products & Services | Rs 4,071.39 lacs | Rs 2,385.76 lacs | Rs 13,871.58 lacs |
| Flax Products | Rs 103.78 lacs | Rs 173.63 lacs | Rs 262.57 lacs |
The Jute segment demonstrated strong recovery with revenue increasing by 70.7% year-on-year for the quarter, while the Flax Products segment experienced a decline of 40.2% during the same period.
Operational Challenges and Market Conditions
The company continues to face significant operational hurdles that impact its performance. Three old manufacturing units remain under prolonged suspension due to labour unrest and machinery obsolescence. Management has initiated several improvement measures including:
- Allocation of financial resources towards capital expenditure
- Repair and overhauling of factory infrastructure and equipment
- Installation of new machinery from overseas and domestic sources
- Major overhauling activities across different units
Market volatility has been intensified by adverse conditions including short crop availability in India and Bangladesh's ban on raw jute exports to India. These factors forced the company to suspend operations at its Jagatdal unit from January 5, 2026, to January 27, 2026. Both Wellington and Jagatdal mills are currently operating at reduced capacity.
Financial Position and Outlook
The company's balance sheet shows total assets of Rs 21,837.61 lacs as of December 31, 2025, compared to Rs 23,495.00 lacs in the previous year. Total liabilities stood at Rs 26,828.28 lacs, up from Rs 23,764.20 lacs in the corresponding period.
Earnings per share for Q3FY26 was negative Rs 1.94 compared to negative Rs 6.70 in Q3FY25, reflecting the reduced losses. The company maintains a paid-up equity share capital of Rs 1,537.69 lacs with a face value of Rs 5 per share.
Additional employee-related liabilities arising from new labour code directives effective from November 2025 remain under assessment and will be provided for in the year-end accounts. The Board of Directors approved these results on February 13, 2026, following review by the Audit Committee and limited review by statutory auditors G Basu & Co.
Historical Stock Returns for AI Champdany Industries
| 1 Day | 5 Days | 1 Month | 6 Months | 1 Year | 5 Years |
|---|---|---|---|---|---|
| +3.39% | +8.66% | +0.41% | +25.21% | -30.63% | +146.80% |
 16
16