

Welspun Corp Q1FY27 PAT jumps 199% to ₹1,046 cr on EPIC sale


Welspun Corp Limited delivered a robust Q1FY27 performance with a consolidated net profit of ₹1,046 crore, a 199% YoY increase primarily due to a ₹548 crore exceptional gain from the partial stake sale of its associate, East Pipes Integrated Company for Industry (EPIC). Excluding this one-time item, operational PAT grew 42% to ₹499 crore, underpinned by a record quarterly EBITDA of ₹756 crore and a 15% rise in revenue to ₹4,081 crore. The company strengthened its net cash position to ₹2,336 crore despite ₹834 crore in capex, while its global order book remains robust at approximately ₹24,750 crore.


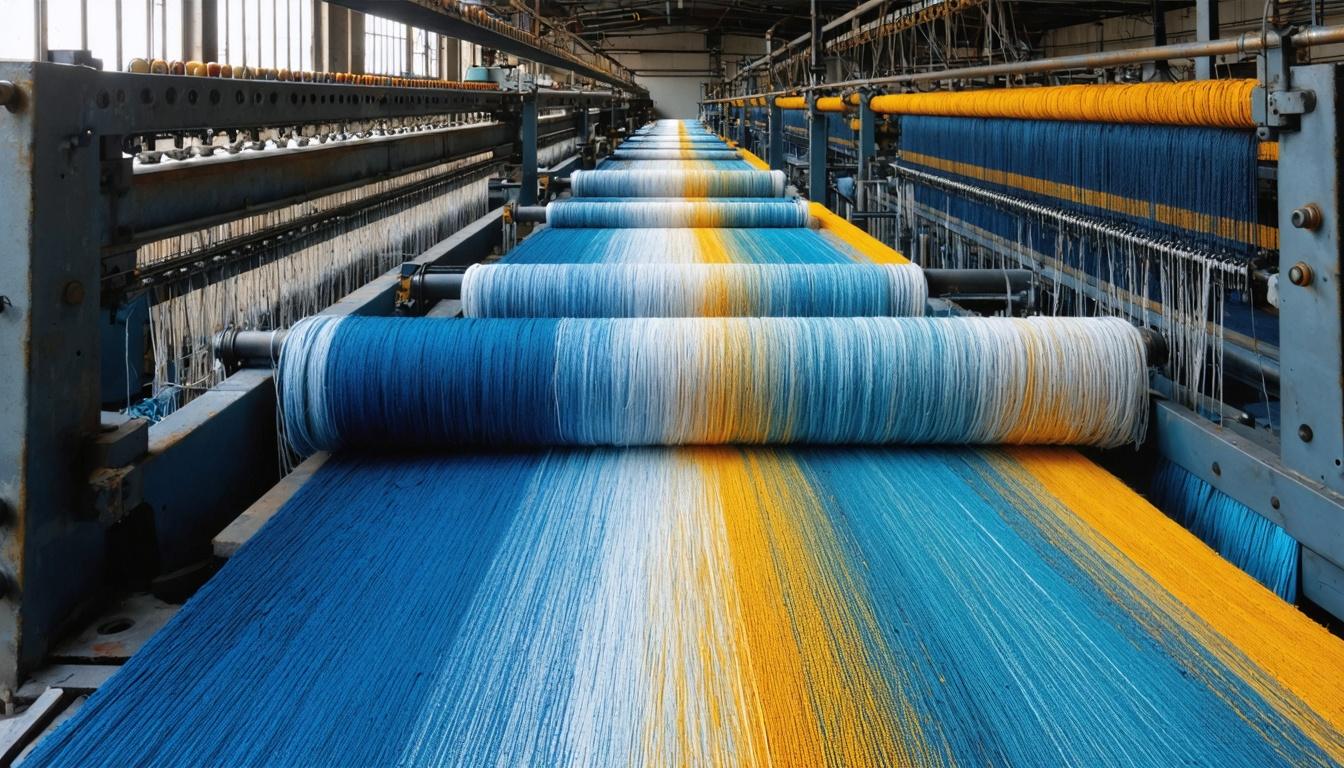
*this image is generated using AI for illustrative purposes only.
Welspun Corp Limited Welspun Corp reported a consolidated net profit (PAT) of ₹1,046 crore for the quarter ended June 30, 2026, marking a 199% year-on-year increase from ₹350 crore in Q1FY26. The significant surge was primarily driven by a one-time exceptional gain of ₹548 crore from the partial stake sale of its associate, East Pipes Integrated Company for Industry (EPIC). Excluding this non-recurring item, operational PAT grew robustly by 42% to ₹499 crore, supported by a record quarterly EBITDA of ₹756 crore. This strong performance underscores the company’s ability to generate substantial cash reserves while expanding its global footprint in key markets like the USA and Kingdom of Saudi Arabia (KSA).
The Board of Directors approved the unaudited financial results at a meeting held on July 24, 2026. The results were reviewed by BSR & Co. LLP, the statutory auditors, pursuant to Regulation 33 and Regulation 52(4) read with Regulation 63 of the SEBI Listing Regulations. The company also announced that its current global order book stands at approximately ₹24,750 crore, providing medium- to long-term visibility into future revenues.
Consolidated Financial Highlights
| Particulars | Q1FY27 (₹ Cr) | Q1FY26 (₹ Cr) | Change (%) |
|---|---|---|---|
| Revenue from operations | 4,081 | 3,551 | 15 |
| EBITDA | 756 | 560 | 35 |
| EBITDA Margin (%) | 18.5 | 15.8 | +270 bps |
| Profit before tax and share of JVs | 586 | 412 | 42 |
| Exceptional Items | 548 | - | - |
| Net Profit (PAT) | 1,046 | 350 | 199 |
| EPS (₹) | 39.7 | 13.3 | 198 |
Revenue from operations increased by 15% to ₹4,081 crore, although it declined 5% quarter-on-quarter from ₹4,313 crore in Q4FY26. Other income rose significantly by 82% year-on-year to ₹64 crore. Total expenses remained controlled, with finance costs decreasing by 28% to ₹45 crore compared to ₹63 crore in the prior year period. Depreciation and amortisation increased by 47% to ₹125 crore, reflecting ongoing capital investments.
Operational Strength and Balance Sheet
The company’s return on capital employed (ROCE) improved to 23.1%, signaling efficient capital utilization. Despite incurring capital expenditure of ₹834 crore during the quarter, Welspun Corp strengthened its net cash position to ₹2,336 crore. This liquidity buffer supports the company’s aggressive expansion plans, including new capacities in the USA and Kingdom of Saudi Arabia (KSA), which are scheduled for commissioning in FY27.
Vipul Mathur, Managing Director and CEO of Welspun Corp Ltd., stated that the company has started the new financial year on a strong note with its highest-ever quarterly EBITDA. He highlighted the healthy balance sheet and robust order book as key drivers for medium- to long-term visibility. Mathur emphasized that strategic expansions in the USA and KSA are on track, reinforcing the company’s leadership position in the global line pipe industry despite a challenging geopolitical backdrop.
Business Environment and Sustainability
Demand visibility remains strong across key geographies. In the USA, rising LNG exports and domestic power infrastructure requirements driven by AI data centres are supporting pipeline demand. In KSA, investments in oil and gas projects, water infrastructure, and hydrogen initiatives are expected to sustain growth. In India, government focus on the National Gas Grid, City Gas Distribution, and Jal Jeevan Mission continues to drive demand for line and water pipes.
Additionally, Welspun Corp’s Bhopal facility achieved Zero Waste to Landfill – Platinum Category for FY 2025–26, underscoring the company’s commitment to sustainability. The plastic pipes business has extended its footprint to 11 states, with OPVC pipe approvals gaining momentum across regions.
What the Numbers Show
The consolidated net profit figure is heavily skewed by non-operational gains. While total revenue grew by 15%, the net profit nearly tripled due to the ₹548 crore gain from the EPIC share sale. Operational profitability, measured by EBITDA, grew by 35% to ₹756 crore, indicating strong underlying business momentum. The expansion of EBITDA margin by 270 basis points to 18.5% demonstrates improved pricing power or cost efficiencies. The simultaneous improvement in ROCE to 23.1% and strengthening net cash position, despite high capex, reflects disciplined capital allocation and strong cash generation capabilities.
Historical Stock Returns for Welspun Corp
| 1 Day | 5 Days | 1 Month | 6 Months | 1 Year | 5 Years |
|---|---|---|---|---|---|
| -4.71% | -7.20% | -6.23% | +149.61% | +204.20% | +1,599.26% |

How will the commissioning of new capacities in the USA and KSA in FY27 impact Welspun Corp's revenue mix and exposure to geopolitical risks in these regions?
Given the significant one-time gain from the EPIC stake sale, what is the company's strategy for deploying the strengthened net cash position of ₹2,336 crore in the near term?
To what extent will the rising demand for LNG infrastructure driven by AI data centres in the USA sustain the current EBITDA margin expansion beyond this quarter?
 19
19







 Access 50+ Readymade Screeners
  Use 200+ Custom Filters
  Get Full Market Insights





