

Vruddhi Engineering FY26 Results: Net profit up 106% to ₹308 lakh


- Net profit rose 106% YoY to ₹307.77 lakh in FY26
- Revenue from operations grew 35% to ₹4,300.37 lakh
- Trade receivables surged to ₹1,195.75 lakh, impacting operating cash flow
- Statutory auditor issued unmodified opinion on FY26 results

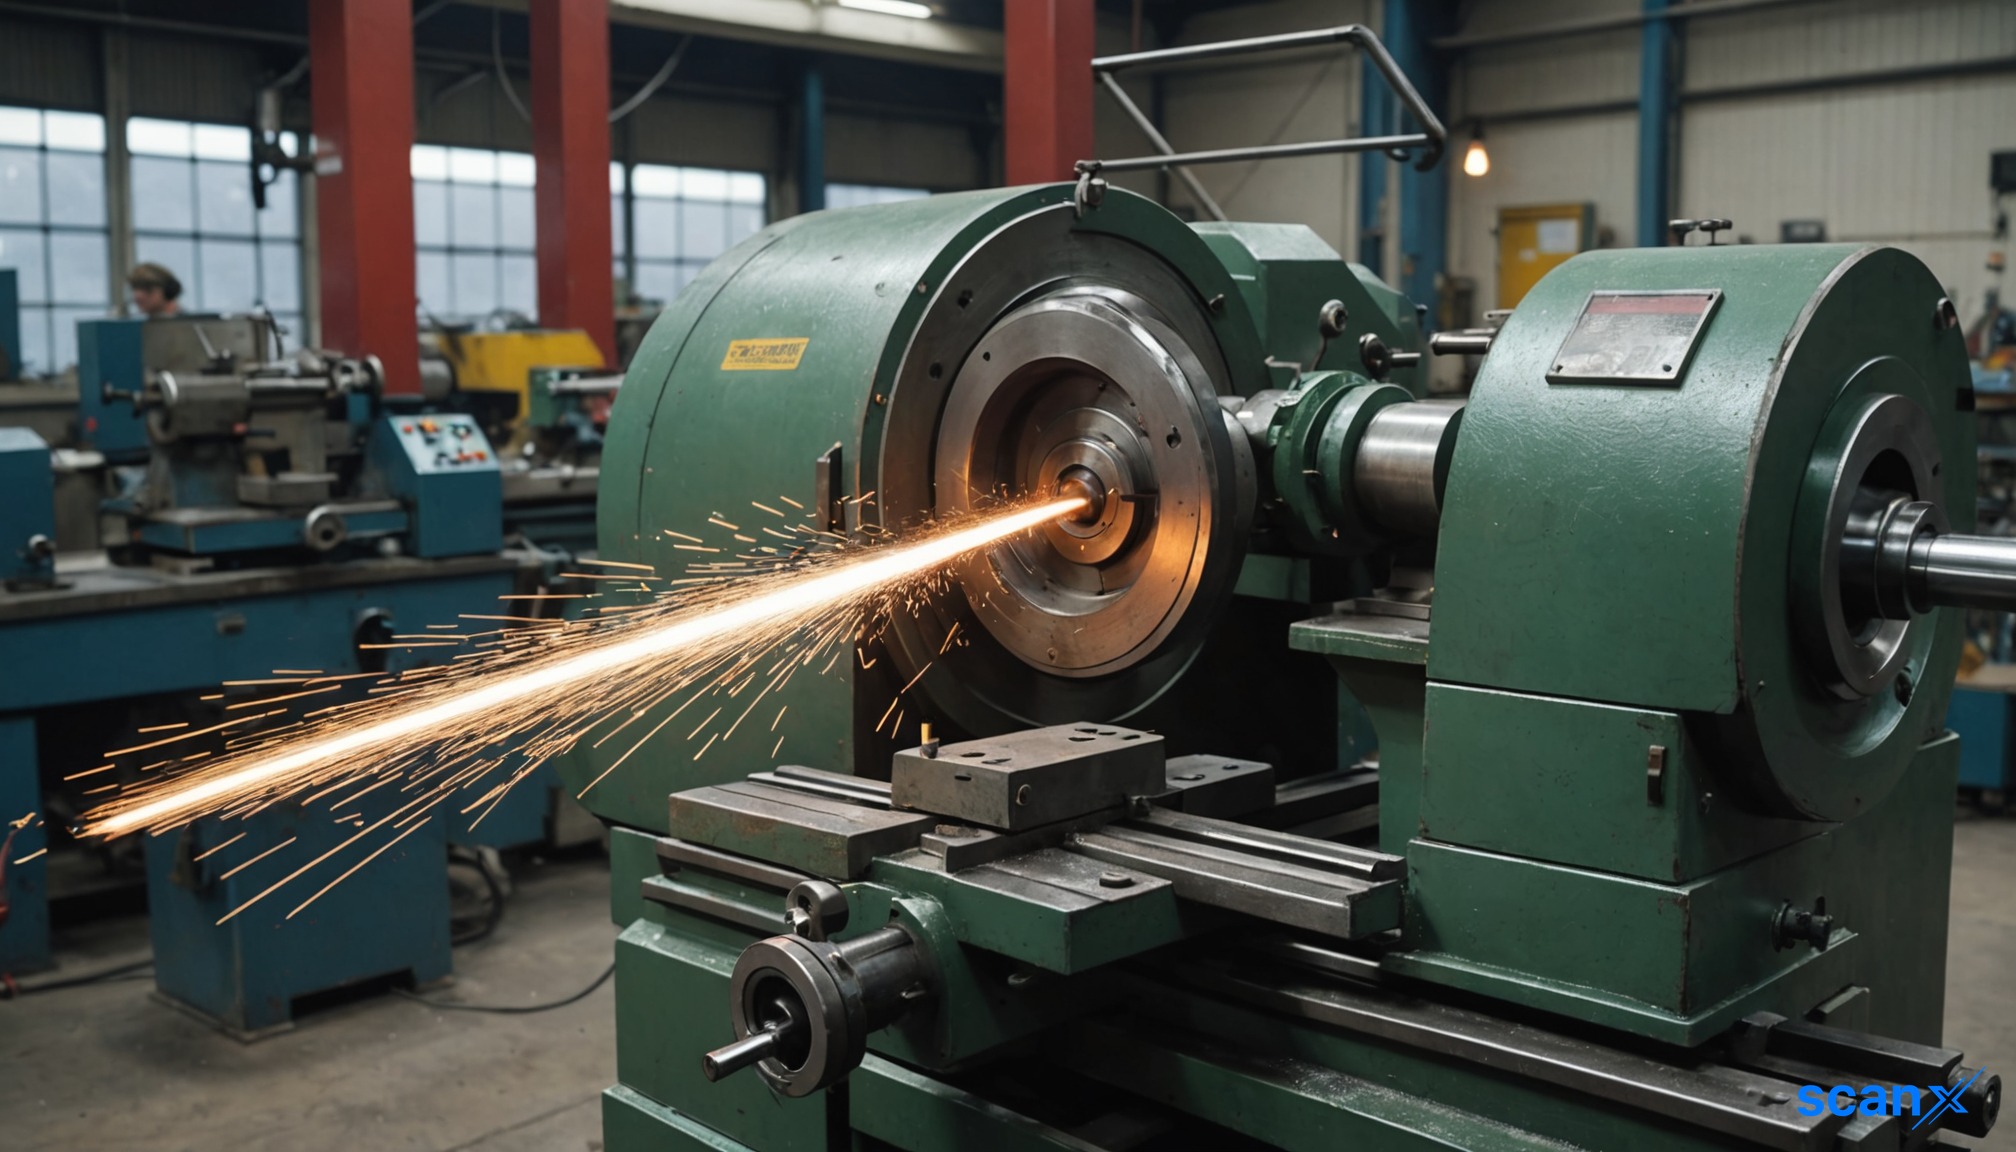

*this image is generated using AI for illustrative purposes only.
Vruddhi Engineering Works Limited reported a 106% year-on-year increase in net profit for FY26, reaching ₹307.77 lakh. The Mumbai-based firm also logged a 35% rise in revenue from operations to ₹4,300.37 lakh, reflecting robust demand in its core mechanical slicing solutions segment.
The company’s Board of Directors approved these audited standalone financial results on May 28, 2026. The statutory auditor, M/s. Maheshwari & Co., issued an unmodified opinion on the financial statements, confirming their compliance with applicable accounting standards and SEBI regulations.
Financial Performance Overview
Vruddhi Engineering demonstrated significant margin expansion alongside top-line growth. Profit before tax more than doubled to ₹416.33 lakh, compared to ₹203.95 lakh in the previous fiscal year. This surge was supported by disciplined cost management, as total expenditure grew at a slower pace than revenue.
| Metric | FY26 (Audited) | FY25 (Audited) | Change |
|---|---|---|---|
| Revenue from operations | ₹4,300.37 lakh | ₹3,180.23 lakh | +35.2% |
| Total Income | ₹4,311.53 lakh | ₹3,183.41 lakh | +35.4% |
| Profit Before Tax | ₹416.33 lakh | ₹203.95 lakh | +104.1% |
| Net Profit (PAT) | ₹307.77 lakh | ₹149.15 lakh | +106.3% |
| EPS (Basic) | ₹12.20 | ₹5.91 | +106.4% |
What the Numbers Show
A critical divergence appears between profit growth and working capital dynamics. While net profit doubled, trade receivables increased significantly from ₹802.02 lakh to ₹1,195.75 lakh, absorbing ₹393.73 lakh in operating cash flow. Despite this outflow, the company generated positive net cash from operations of ₹299.66 lakh in FY26, a stark improvement from the negative ₹352.65 lakh recorded in FY25. This shift suggests that while collections have slowed relative to revenue growth, overall liquidity management has stabilized considerably.
Balance Sheet and Cash Flow Highlights
The company’s equity base strengthened, with reserves and surplus rising to ₹900.97 lakh from ₹593.20 lakh in the previous year. Non-current investments saw a substantial jump to ₹302.39 lakh, indicating strategic capital deployment. Conversely, short-term borrowings increased to ₹596.49 lakh, up from ₹399.64 lakh, highlighting a reliance on short-term debt to fund working capital needs.
Cash and cash equivalents ended the year at ₹18.10 lakh, down from ₹40.03 lakh, primarily due to ₹154.31 lakh spent on property, plant, and equipment and ₹301.09 lakh on investments. The revised filing corrected an inadvertent error in the cash flow statement regarding provisions, though this did not alter the final net profit or revenue figures.
Historical Stock Returns for VRUDDHI
| 1 Day | 5 Days | 1 Month | 6 Months | 1 Year | 5 Years |
|---|---|---|---|---|---|
| -3.13% | -3.13% | -18.42% | 0.0% | -27.57% | +107.91% |

How will the significant increase in trade receivables impact Vruddhi Engineering's working capital cycle and cash conversion efficiency in the coming quarters?
What specific strategic opportunities are driving the substantial jump in non-current investments, and how do they align with the company's long-term growth objectives?
Given the reliance on short-term borrowings to fund operations, what is the company's plan to optimize its debt structure to mitigate interest rate risks?
 18
18









 Access 50+ Readymade Screeners
  Use 200+ Custom Filters
  Get Full Market Insights





