

Vesuvius India Q2 Results: Net Profit Down 7% YoY To ₹58.5 Crore


Vesuvius India reported Q2FY27 net profit of ₹58.5 crore, down 7.1% YoY, while revenue rose 2.3% to ₹535.4 crore. H1FY27 revenue grew 2.9% to ₹1,036.0 crore, but net profit fell 6.5% to ₹114.4 crore. Rising material costs pressured margins. Statutory auditors issued an unmodified opinion on the results approved by the Board on August 12, 2026.


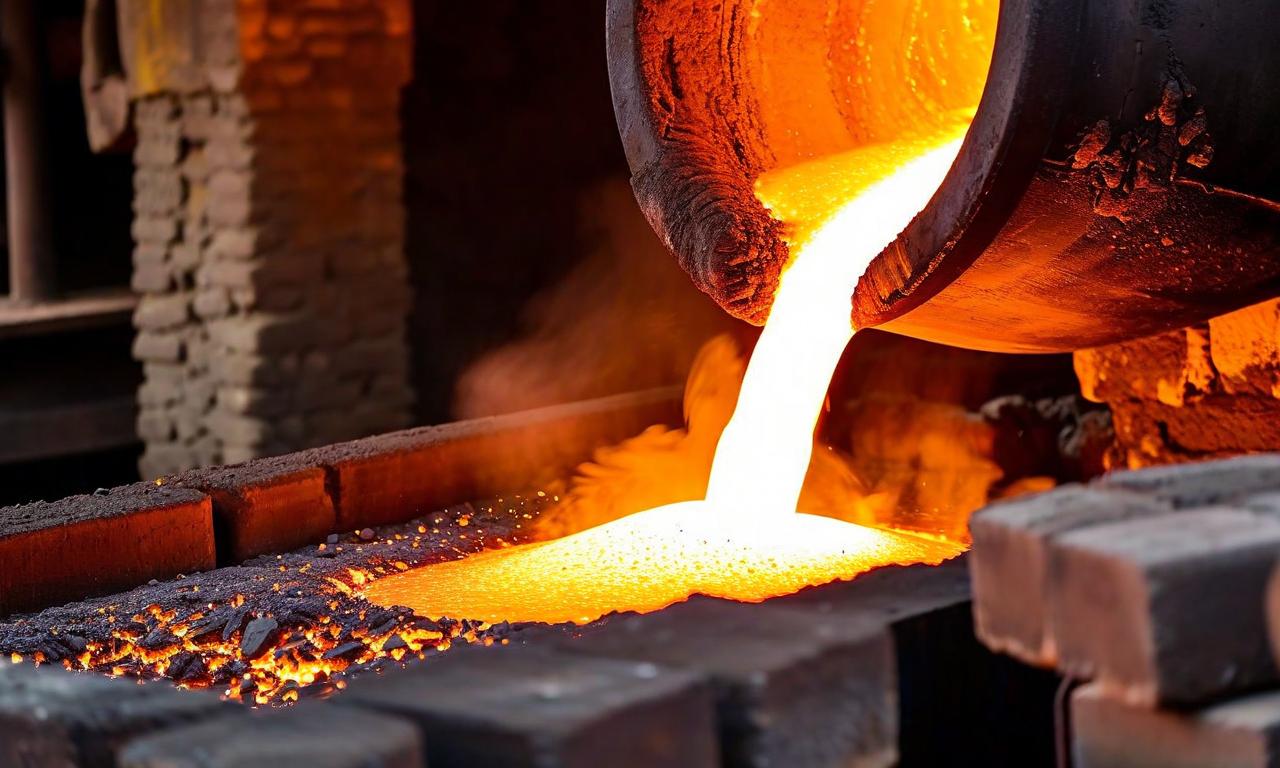
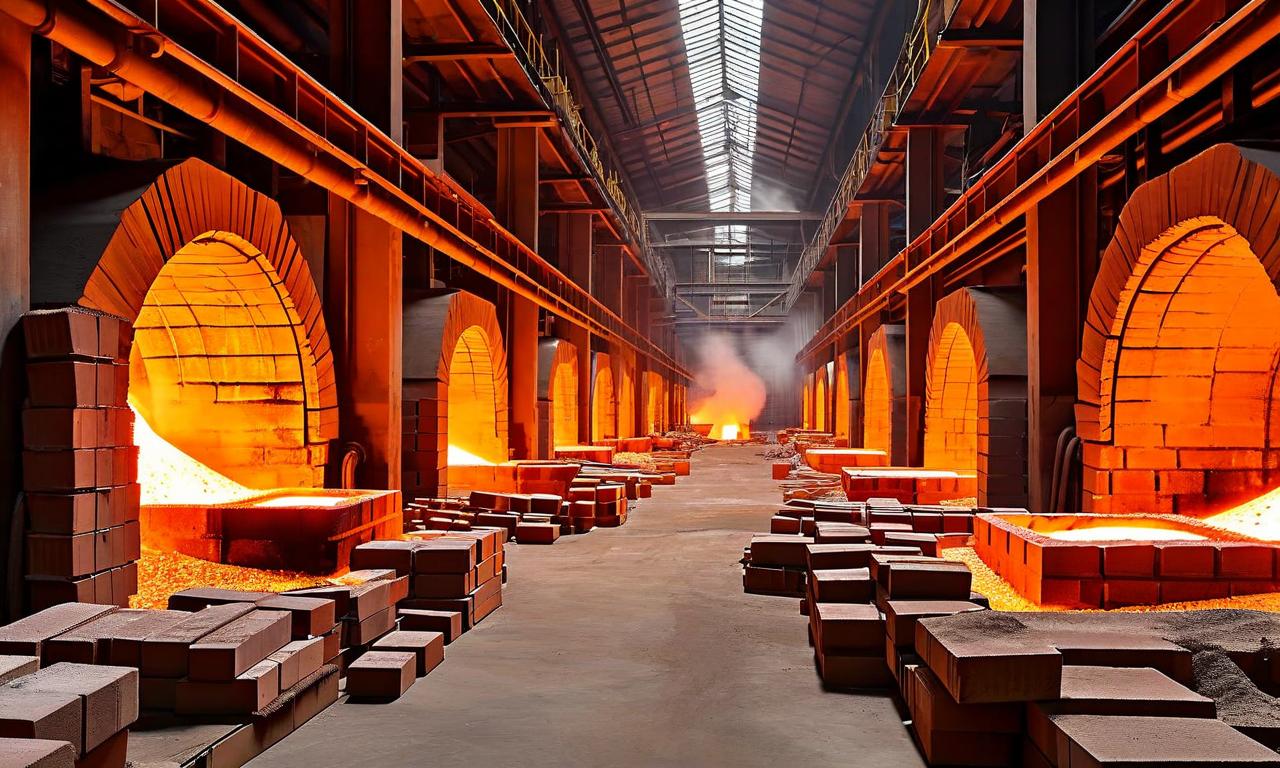
*this image is generated using AI for illustrative purposes only.
Vesuvius India Limited reported a decline in net profit for its second quarter of fiscal year 2027, driven by higher operating costs despite modest revenue growth. The refractory manufacturer posted a net profit of ₹58.5 crore for the quarter ended June 30, 2026, down from ₹63.0 crore in the same period last year. This represents a 7.1% year-on-year decrease. However, the company’s top line expanded by 2.3% to reach ₹535.4 crore, compared to ₹523.5 crore in Q2FY26.
For the first half of FY27 (H1), the company’s total income from operations rose 2.9% to ₹1,036.0 crore from ₹1,006.5 crore in H1FY26. Despite this growth in sales, net profit for the six-month period fell 6.5% to ₹114.4 crore, down from ₹122.3 crore in the corresponding prior-year period. Earnings per share (basic and diluted) stood at ₹2.88 for the quarter, compared to ₹3.11 in Q2FY25.
Financial Performance Breakdown
The company’s operational expenses increased during the period, impacting bottom-line results. Cost of materials consumed rose significantly to ₹260.8 crore in Q2FY27 from ₹202.4 crore in Q2FY26. Employee benefits expense also saw an uptick to ₹35.7 crore from ₹33.9 crore. Other operating expenses were recorded at ₹113.3 crore, up from ₹106.5 crore a year ago.
| Metric | Q2FY27 (₹ crore) | Q2FY26 (₹ crore) | YoY Change |
|---|---|---|---|
| Total Income | 546.2 | 532.8 | +2.5% |
| Total Expenses | 467.5 | 448.1 | +4.3% |
| Profit Before Tax | 78.7 | 84.7 | -7.0% |
| Net Profit | 58.5 | 63.0 | -7.1% |
Tax expense for the quarter was ₹20.2 crore, slightly lower than the ₹21.7 crore paid in Q2FY26. The effective tax rate remained relatively stable as deferred tax charges offset current tax liabilities.
Balance Sheet and Cash Flow Signals
As of June 30, 2026, Vesuvius India’s total assets stood at ₹2,214.8 crore, an increase from ₹2,149.6 crore at the end of FY25. Current assets grew to ₹1,486.8 crore, primarily driven by an increase in trade receivables to ₹520.5 crore from ₹483.7 crore. Inventories also rose to ₹323.9 crore from ₹296.5 crore.
Cash and cash equivalents decreased marginally to ₹282.0 crore from ₹288.0 crore during the half-year. The company generated ₹59.3 crore in net cash inflow from operating activities in H1FY27, compared to ₹48.0 crore in H1FY26. Investing activities resulted in a net outflow of ₹35.0 crore, largely due to capital expenditures of ₹48.9 crore on property, plant, and equipment.
What the Numbers Show
A key divergence in the data is the widening gap between revenue growth and expense inflation. While revenue grew by just over 2%, total expenses expanded by nearly 4.3% year-on-year. Specifically, the cost of materials consumed jumped approximately 29% to ₹260.8 crore, suggesting potential input cost pressures or a shift in product mix that requires closer monitoring in subsequent quarters. Additionally, other income contributed ₹10.0 crore to the top line, constituting roughly 18% of the pre-tax profit, highlighting a continued reliance on non-operating gains to support profitability.
Regulatory and Audit Details
The Board of Directors approved the unaudited standalone financial results for the quarter and half-year ended June 30, 2026, during a meeting held on August 12, 2026. The statutory auditors, Price Waterhouse Chartered Accountants LLP, issued a limited review report with an unmodified opinion, confirming that the statements comply with applicable accounting standards and SEBI LODR regulations. The company operates as a single segment focused on the manufacturing and sale of refractories.
Historical Stock Returns for Vesuvius
| 1 Day | 5 Days | 1 Month | 6 Months | 1 Year | 5 Years |
|---|---|---|---|---|---|
| -3.64% | -0.63% | -6.41% | -12.23% | -23.36% | +224.45% |

Will Vesuvius India be able to pass on the 29% surge in material costs to customers through price hikes, or will margin compression persist in Q3FY27?
How does the rising trade receivables balance of ₹520.5 crore impact the company's working capital efficiency and cash conversion cycle going forward?
Given the reliance on other income for nearly 18% of pre-tax profit, what specific non-operating assets or investments are driving this contribution, and is this trend sustainable?
 19
19






 Access Market Heat-map & Insights
  Create, Save & Share your Screener
  Use 200+ Screening Filters





