

Vedanta Oil & Gas Q2FY27 production falls 19% to 72.2 kboepd


- Average daily gross operated production fell 19% YoY to 72.2 kboepd in Q2FY27
- Sequential decline of 7% driven by natural decline at Rajasthan offset by Ravva optimization
- Cambay block production dropped 76% QoQ following ONGC takeover of operations
- Total gross oil and gas production for the quarter stood at 6.6 million boe

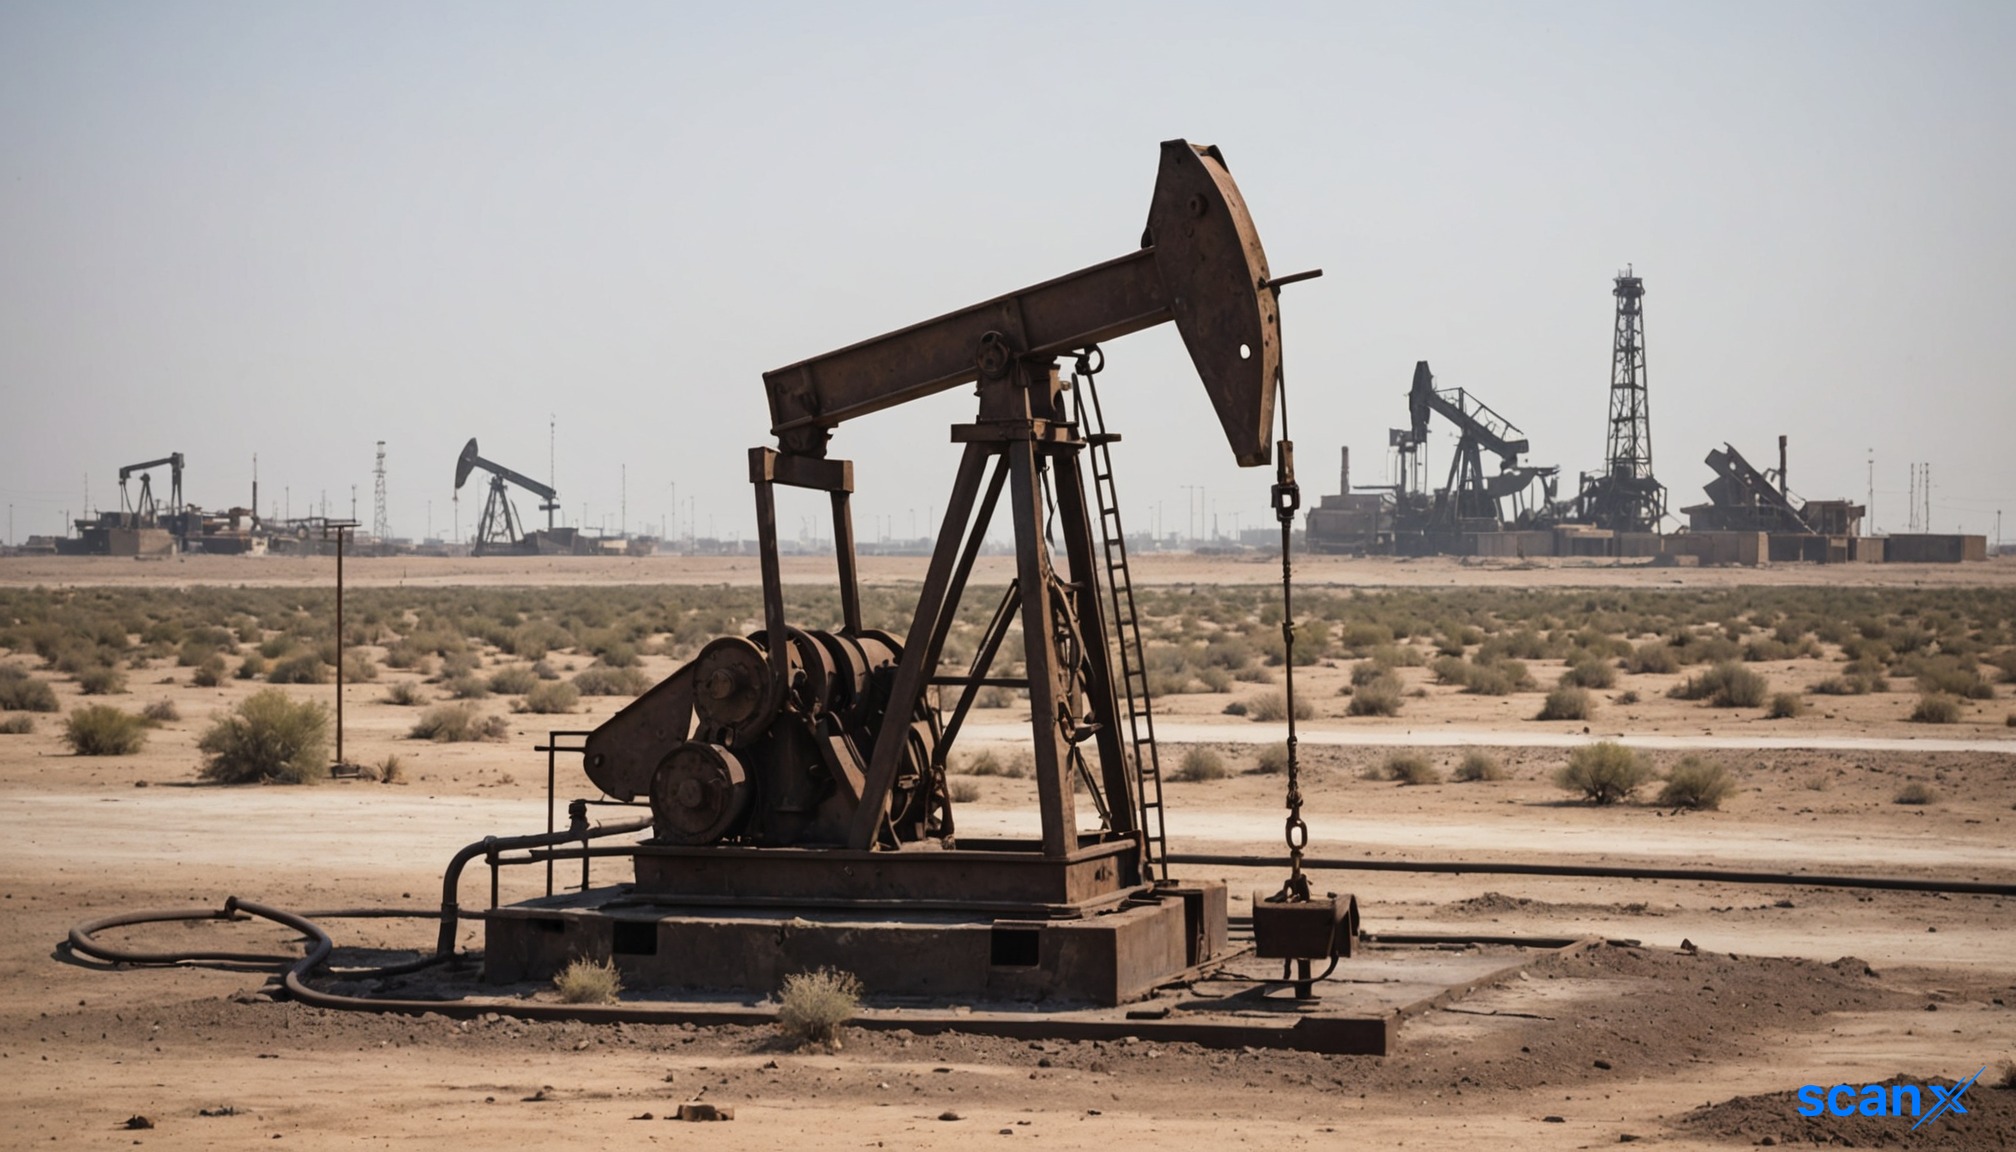

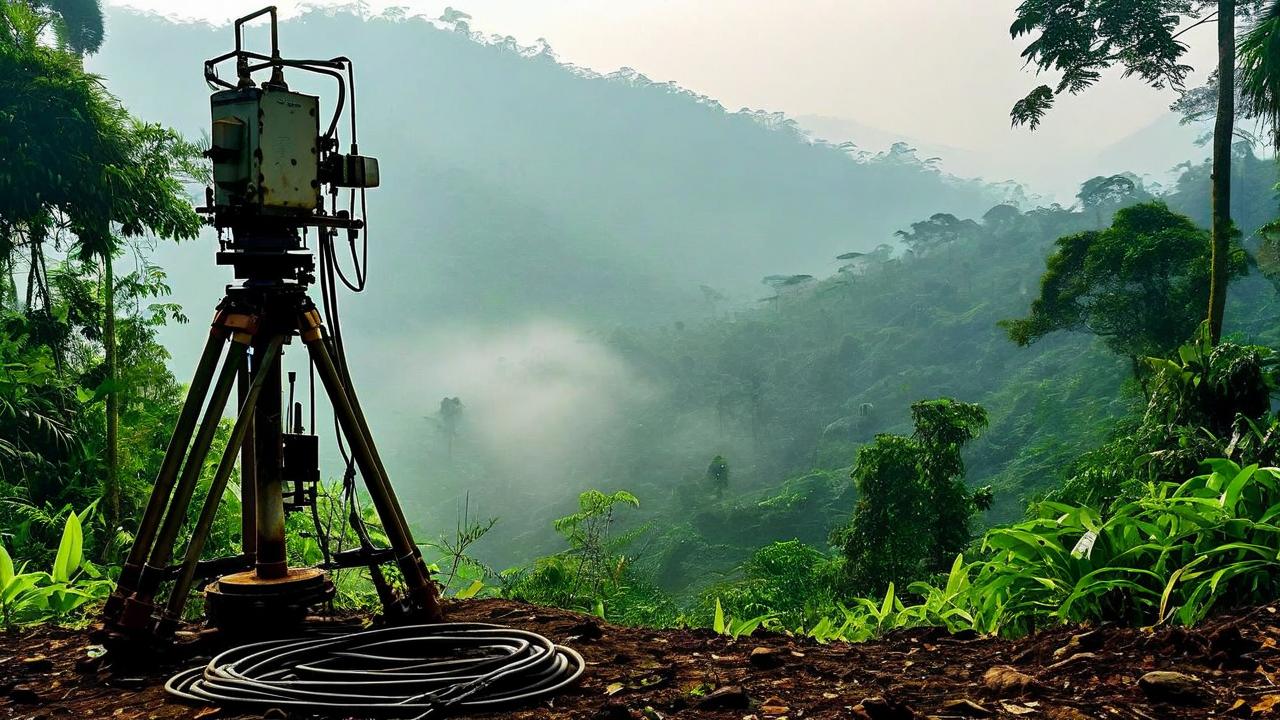
*this image is generated using AI for illustrative purposes only.
Vedanta Oil & Gas reported average daily gross operated production of 72.2 kboepd for the second quarter ended September 30, 2026. This represents a 19% decline compared to 89.1 kboepd recorded in the corresponding period of the previous fiscal year.
The company attributed the sequential drop of 7% from the first quarter to natural decline at Rajasthan, partially offset by successful production optimization initiatives at the Ravva block. The strategic focus remains on arresting base decline through enhanced oil recovery projects and pursuing growth via near-to-medium term opportunities.
Regional production performance
Production across key basins showed mixed trends, with Rajasthan witnessing a significant contraction while Ravva demonstrated resilience and growth on a quarter-on-quarter basis.
| Particulars (kboepd) | Q2FY27 | Q2FY26 | YoY Change | Q1FY27 | QoQ Change |
|---|---|---|---|---|---|
| Average Daily Gross Operated Production | 72.2 | 89.1 | (19%) | 77.7 | (7%) |
| Rajasthan | 59.9 | 70.9 | (15%) | 63.1 | (5%) |
| Ravva | 8.1 | 8.2 | (1%) | 7.0 | 16% |
| Cambay | 1.1 | 6.5 | (83%) | 4.6 | (76%) |
| OALP | 3.1 | 3.6 | (15%) | 3.1 | (0%) |
Working interest and total volumes
Average daily working interest production stood at 47.8 kboepd, down 18% year-on-year from 58.2 kboepd. Total oil and gas production on a gross basis was 6.6 million boe for the quarter, reflecting an 18% decline over the half-year period compared to FY26 levels.
| Metric | Q2FY27 | Q2FY26 | YoY Change | 1H FY27 | 1H FY26 | 1H Change |
|---|---|---|---|---|---|---|
| Avg Daily WI Production (kboepd) | 47.8 | 58.2 | (18%) | 49.4 | 59.5 | (17%) |
| Total Oil and Gas Gross (million boe) | 6.6 | 8.2 | (19%) | 13.7 | 16.7 | (18%) |
| Total Oil and Gas WI (million boe) | 4.4 | 5.4 | (18%) | 9.0 | 10.9 | (17%) |
What the numbers show
A stark divergence is visible between the Ravva and Cambay blocks. While Ravva production grew 16% sequentially due to optimization efforts, Cambay volumes collapsed by 76% quarter-on-quarter to 1.1 kboepd. This sharp decline in Cambay is not merely operational but structural; the block's average production was factored only until July 21, 2026, following ONGC's takeover of operations on July 24, 2026. The loss of this asset significantly drags down the overall portfolio performance, masking the relative stability in other producing assets like OALP, which remained flat at 3.1 kboepd sequentially.
Historical Stock Returns for Vedanta Oil & Gas
| 1 Day | 5 Days | 1 Month | 6 Months | 1 Year | 5 Years |
|---|---|---|---|---|---|
| +0.26% | -1.43% | -17.11% | -15.71% | -15.71% | -15.71% |

What specific enhanced oil recovery projects are planned for the Rajasthan block to arrest the ongoing base decline?
How will the permanent loss of Cambay production impact Vedanta's long-term production guidance and revenue projections?
Can the Ravva block's optimization initiatives be scaled to other assets to offset declining output in Rajasthan?
 16
16






 Access Market Heat-map & Insights
  Create, Save & Share your Screener
  Use 200+ Screening Filters





