Vedant Fashions FY26: ₹14,355 Mn Revenue, ₹7.75 Dividend


Vedant Fashions reported a 3.5% year-on-year increase in revenue from operations to ₹14,355 million for FY26, while net profit stood at ₹3,755 million. The board recommended a final dividend of ₹7.75 per share. The company expanded its retail footprint to 669 EBOs and recorded positive same-store sales growth.


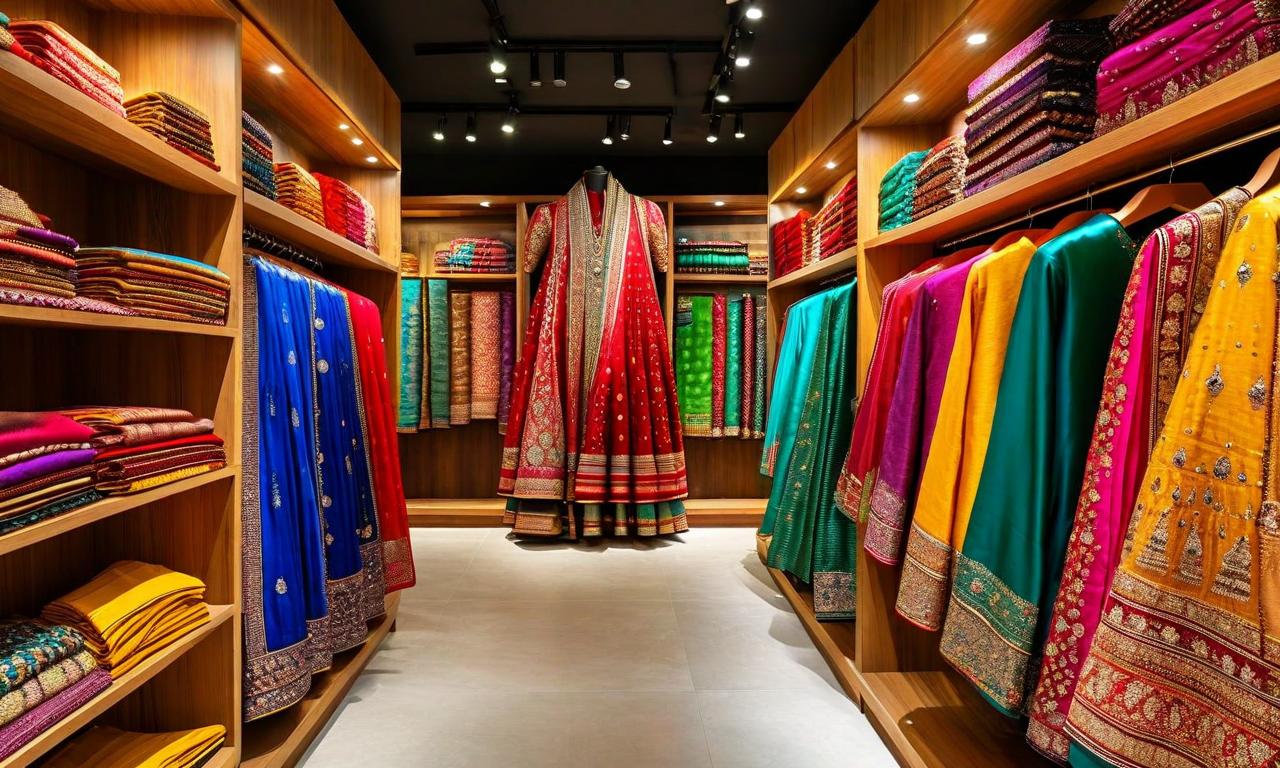
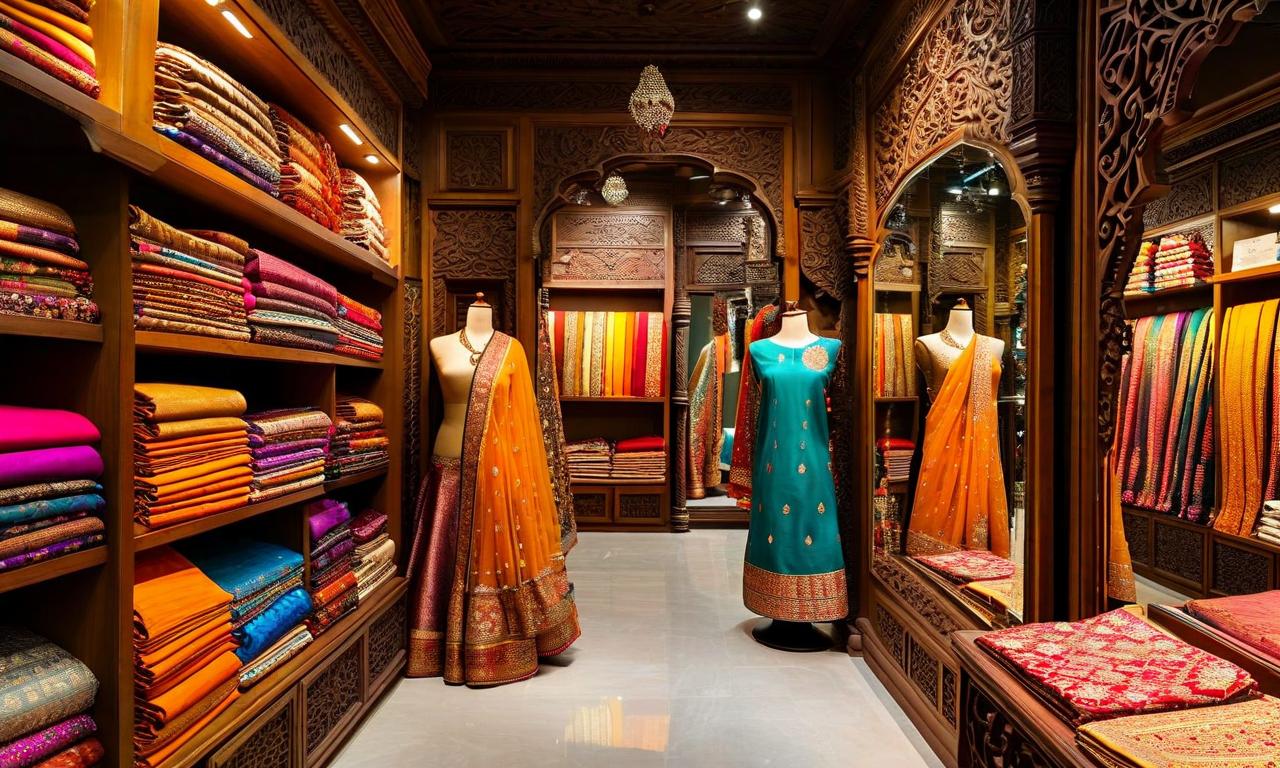
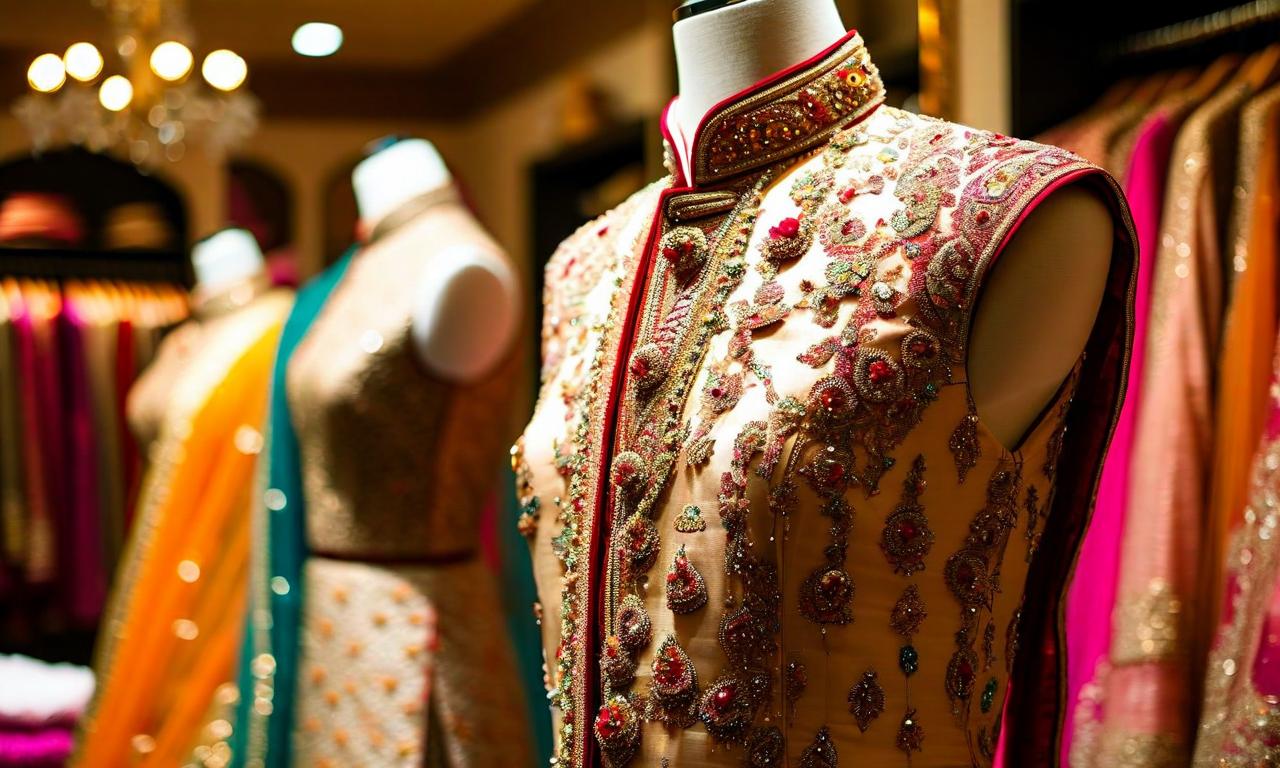
*this image is generated using AI for illustrative purposes only.
Vedant Fashions Limited's Board of Directors approved the audited financial results for the quarter and financial year ended March 31, 2026. The statutory auditors, M/s B S R & Co. LLP, issued an audit report with an unmodified opinion. Additionally, the board recommended a final dividend of ₹7.75 per fully paid-up equity share of ₹1 each for FY26, subject to shareholder approval. The company has also released its investor presentation for May 2026, detailing operational highlights and strategic initiatives.
FY26 Financial Performance
Vedant Fashions reported revenue from operations of ₹14,355 million for the full year ended March 31, 2026, compared to ₹13,865 million in the previous year. Total income, including other income of ₹935 million, stood at ₹15,290 million. The company's net profit for FY26 came in at ₹3,755 million against ₹3,885 million in FY25. The following table summarises the key financial metrics:
| Metric: | FY26 (Audited) | FY25 (Audited) |
|---|---|---|
| Revenue from Operations: | ₹14,355 Mn | ₹13,865 Mn |
| Other Income: | ₹935 Mn | ₹852 Mn |
| Total Income: | ₹15,290 Mn | ₹14,716 Mn |
| Total Expenses: | ₹10,331 Mn | ₹9,521 Mn |
| Profit Before Tax: | ₹4,959 Mn | ₹5,195 Mn |
| Total Tax Expense: | ₹1,204 Mn | ₹1,310 Mn |
| Net Profit: | ₹3,755 Mn | ₹3,885 Mn |
| Basic EPS (INR per share): | ₹15.46 | ₹15.99 |
Q4FY26 Quarterly Snapshot
For the quarter ended March 31, 2026, the company reported revenue from operations of ₹3,994 million, compared to ₹3,674 million in the same quarter of the previous year. Quarterly net profit stood at ₹1,143 million versus ₹1,011 million in Q4FY25. On the operational front, Q4FY26 EBITDA came in at 1.79B rupees compared to 1.66B rupees in Q4FY25, while EBITDA margin expanded to 45.6% from 45.1% in the year-ago period. The table below presents the quarterly performance comparison:
| Metric: | Q4FY26 (Unaudited) | Q4FY25 (Unaudited) |
|---|---|---|
| Revenue from Operations: | ₹3,994 Mn | ₹3,674 Mn |
| Total Income: | ₹4,258 Mn | ₹3,895 Mn |
| EBITDA: | 1.79B Rupees | 1.66B Rupees |
| EBITDA Margin: | 45.6% | 45.1% |
| Net Profit: | ₹1,143 Mn | ₹1,011 Mn |
| Basic EPS (INR per share): | ₹4.71 | ₹4.16 |
Operational Highlights and Expansion
The company reported a retail footprint of 1.79 million sq. ft. as of FY26, comprising 669 Exclusive Brand Outlets (EBOs) across 252 cities and towns globally, including 17 international EBOs. During Q4 FY26, the company added a net of 5 EBOs and expanded its EBO area by 4.2k sq. ft. Vedant Fashions recorded Same Store Sales Growth (SSSG) of +4.6% in Q4 FY26 over Q4 FY25 and +2.7% in FY26 over FY25. The company operates through a diversified brand portfolio including Manyavar, Mohey, Twamev, Diwas, and Mebaz, catering to various segments of the Indian wedding and celebration wear market.
Balance Sheet and Cash Flow
As at March 31, 2026, Vedant Fashions reported total assets of ₹28,527 million, up from ₹27,466 million as at March 31, 2025. Total equity stood at ₹19,643 million. For the year ended March 31, 2026, the company generated net cash from operating activities of ₹4,814 million. Net cash used in investing activities was ₹(1,020) million, while net cash used in financing activities amounted to ₹(3,856) million. Cash and cash equivalents at the end of the year stood at ₹111 million.
Corporate Notes
The board has recommended a final dividend of ₹7.75 per equity share for FY26, subject to shareholder approval at the ensuing AGM. The financial results were reviewed by the Audit Committee and approved by the Board of Directors. The company operates in a single reportable segment — Branded Fashion Apparel and Accessories. The investor presentation is available on the company's website.
Source: Company/INE825V01034/f86d7d37-d863-4230-819a-f8194e64336a.pdf
Historical Stock Returns for Vedant Fashions
| 1 Day | 5 Days | 1 Month | 6 Months | 1 Year | 5 Years |
|---|---|---|---|---|---|
| -1.37% | +0.84% | -3.64% | -17.31% | -49.41% | -56.92% |
Given the consistent margin compression across gross, EBITDA, and PAT levels in FY26, what strategic initiatives is Vedant Fashions likely to pursue in FY27 to reverse this profitability trend?
With net EBO area rollout slowing to just 4.2k sq. ft. in FY26, will the company accelerate its international expansion in markets like the USA and UAE to drive future revenue growth?
As SSSG of +2.7% for FY26 remains modest, how might Vedant Fashions leverage digital channels or product diversification to meaningfully boost same-store sales performance going forward?
 16
16