

Valiant Organics FY26 Results: Net profit turns positive at ₹34 crore


- Valiant Organics reported FY26 net profit of ₹34 crore, reversing losses of ₹3 crore each in FY24 and FY25
- FY26 EBITDA rose to ₹101 crore with a margin of 13.64%, up from ₹62 crore and 8.60% in FY25
- Operational revenue grew to ₹739 crore in FY26 from ₹719 crore in FY25
- Hydrogenation contributed 48% of FY26 revenue; dyes and pigments was the largest end-user segment at 45%
- The company operates 6 manufacturing units across 5 locations with a total production capacity of 80,000 TPA


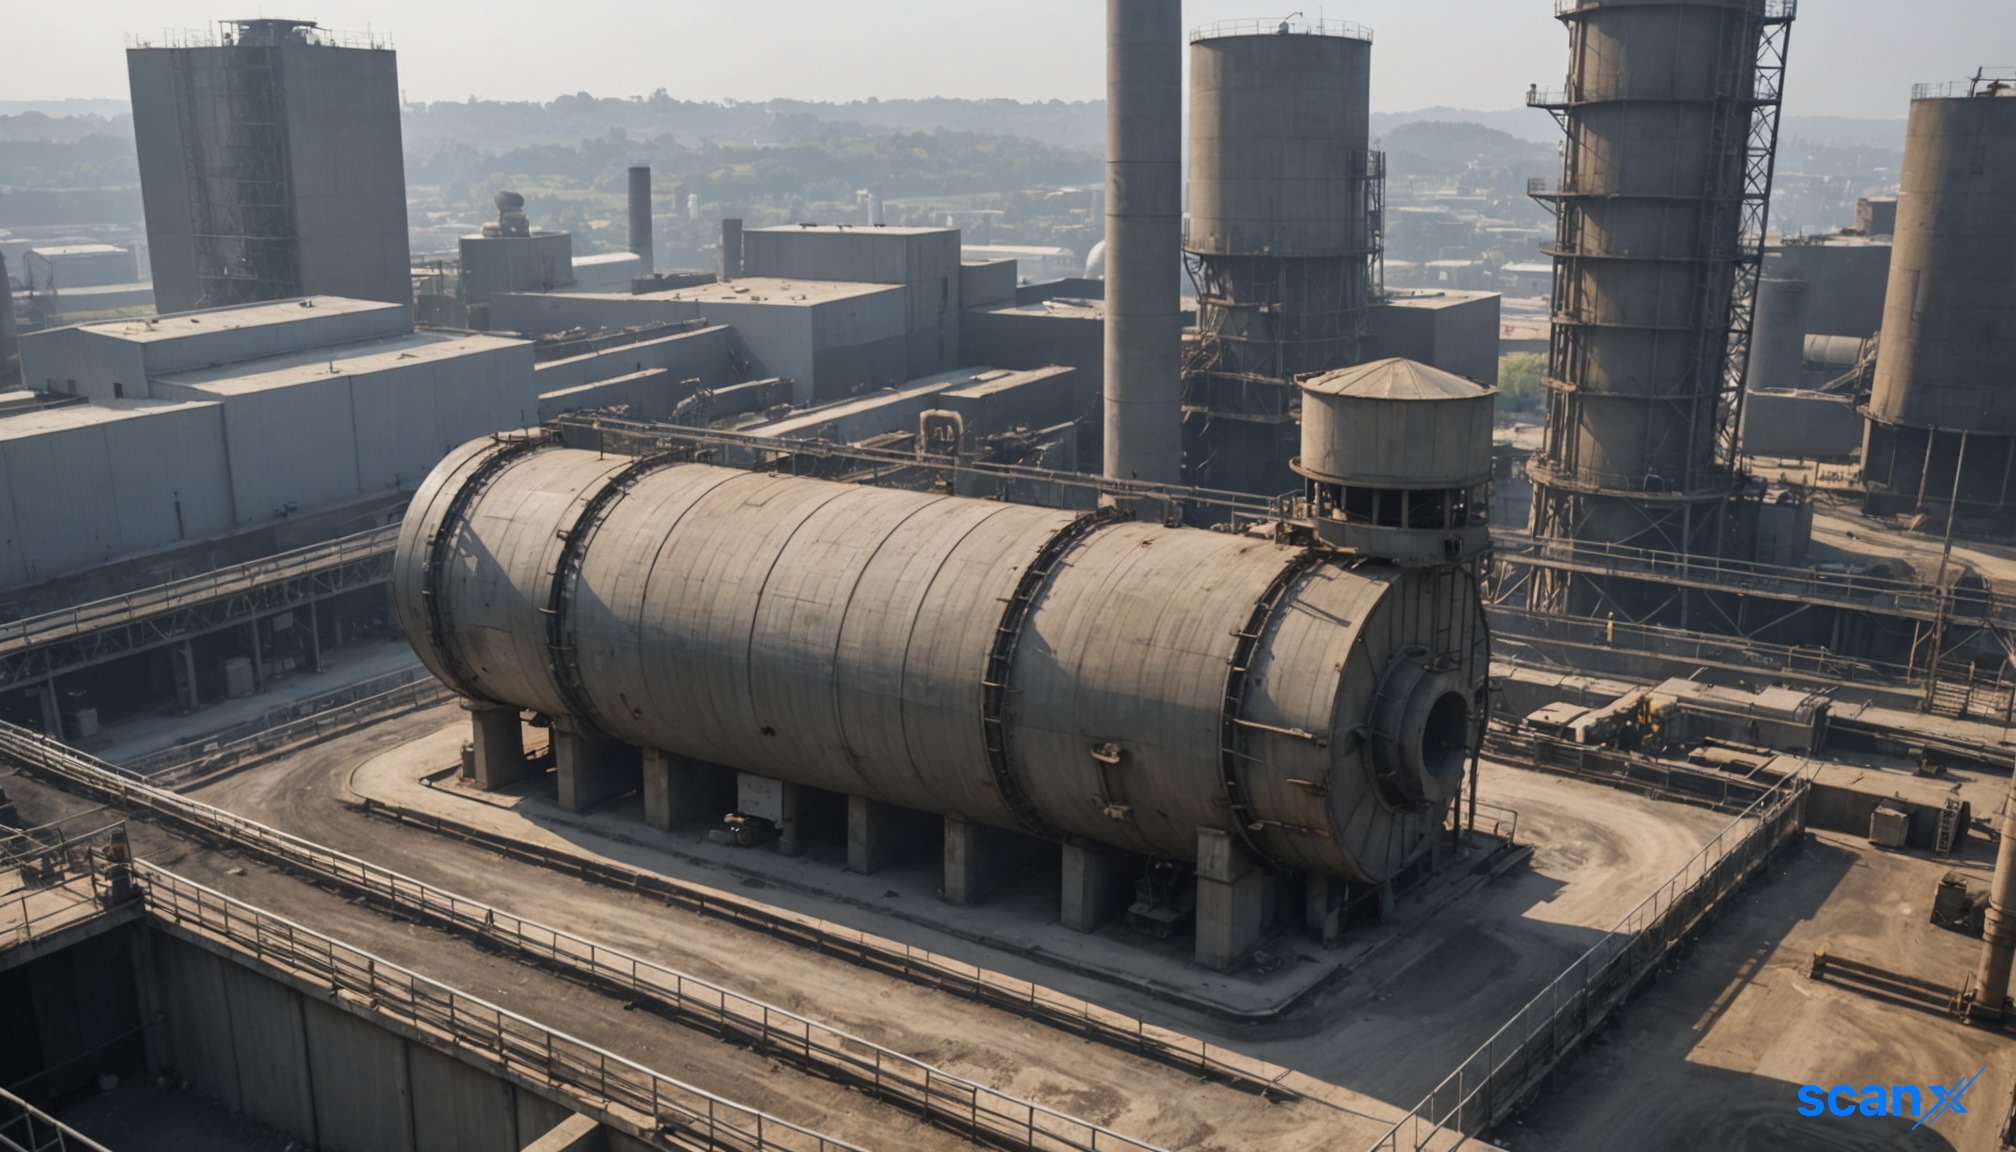
*this image is generated using AI for illustrative purposes only.
Valiant Organics Limited reported a net profit of ₹34 crore in FY26, reversing two consecutive years of losses, as EBITDA climbed to ₹101 crore on revenue of ₹739 crore.
The company presented these results at its 21st Annual General Meeting held on September 29, 2026. The presentation was submitted to BSE and the National Stock Exchange of India under Regulation 30 of the SEBI (Listing Obligations and Disclosure Requirements) Regulations, 2015. As on March 31, 2026, Valiant Organics carried a market capitalisation of ₹~567 crore.
Financial performance across FY23 to FY26
The following table captures the company's key consolidated financial metrics over four fiscal years.
| Metric | FY23 | FY24 | FY25 | FY26 |
|---|---|---|---|---|
| Operational revenue (₹ crore) | 912 | 677 | 719 | 739 |
| EBITDA (₹ crore) | 133 | 42 | 62 | 101 |
| EBITDA margin (%) | 14.58% | 6.20% | 8.60% | 13.64% |
| PAT (₹ crore) | 76 | -3 | -3 | 34 |
| PAT margin (%) | 8.33% | -0.44% | -0.47% | 4.65% |
| Net worth (₹ crore) | 585 | 583 | 570 | 588 |
| Net debt to equity (x) | 0.32 | 0.32 | 0.33 | 0.33 |
| ROCE (%) | 14.77% | 1.00% | 3.42% | 8.02% |
| ROE (%) | 14.00% | -1.14% | -0.47% | 4.48% |
FY26 EBITDA of ₹101 crore and a margin of 13.64% represent a marked recovery from FY24's low of ₹42 crore and 6.20% margin. The return on capital employed rose to 8.02% in FY26 from 3.42% in FY25, while return on equity turned positive at 4.48% after two years in negative territory.
What the numbers show
Revenue contracted from ₹912 crore in FY23 to ₹677 crore in FY24 before recovering to ₹719 crore in FY25 and ₹739 crore in FY26. Profitability followed a sharper trajectory: PAT fell from ₹76 crore in FY23 to a loss of ₹3 crore in each of FY24 and FY25, then recovered to ₹34 crore in FY26. Net worth, which had declined from ₹585 crore in FY23 to ₹570 crore in FY25, edged back up to ₹588 crore in FY26. Net debt to equity remained stable at 0.33x across FY25 and FY26.
FY26 revenue composition
Hydrogen-based chemistries dominated the revenue mix, with Hydrogenation accounting for the largest share. The breakdown by chemistry and end-user industry is presented below.
| Chemistry | FY26 revenue share |
|---|---|
| Hydrogenation | 48% |
| Ammonolysis | 26% |
| Chlorination | 20% |
| Others | 6% |
| End-user industry | FY26 revenue share |
|---|---|
| Dyes and pigments | 45% |
| Agro chemicals | 24% |
| Pharmaceuticals | 21% |
| Specialty chemicals | 10% |
Operations and manufacturing footprint
Valiant Organics was incorporated in 1984 and is headquartered in Mumbai. The company manufactures specialty chemicals serving agrochemicals, pharmaceuticals, dyes, pigments, and veterinary medications. It operates 6 manufacturing units across 5 locations with a total production capacity of 80,000 TPA, and maintains 5 Zero Liquid Discharge plants. The workforce stands at 900+ employees.
The manufacturing units span Gujarat and Maharashtra, with capacities and primary products as follows:
| Unit | Location | Capacity | Key products |
|---|---|---|---|
| Chlorination | Sarigam | 21,600 MTPA | PCP, OCP, 2,4 DCP, 2,6 DCP, 2,4,6 TCP |
| Ammonolysis | Vapi | 10,000 MTPA | PNA, OCPNA |
| Ammonolysis | Tarapur | 6,600 MTPA | PNA |
| Hydrogenation and Methoxylation | Jhagadia Unit 1 | 28,800 MTPA | ONA/OA, PNA/PA, IPPCA, conversion products |
| Hydrogenation | Jhagadia Unit 2 | 12,000 MTPA | PAP, pharma intermediates |
| Acetylation and Sulphonation | Ahmedabad | 1,800 MTPA | 6 Acetyl OAPSA, OA/PA Acetanilide, OT5SA |
The company positions itself as one of the largest chlorophenol derivatives manufacturers globally, one of the largest domestic Para Nitro Aniline (PNA) manufacturers, and among the first few domestic Para Amino Phenol (PAP) manufacturers. It also describes itself as one of the few commercial players in Ortho Anisidine and Para Anisidine.
Note: Pursuant to the allotment of further equity shares through the IPO by the company's material step-down subsidiary Valiant Laboratories Limited, the stake of subsidiary Dhanvallabh Ventures LLP in Valiant Laboratories Limited was diluted to 46.83%, and accordingly Valiant Laboratories Limited ceased to be a step-down subsidiary and became an associate company with effect from October 4, 2023. Consolidated financials of previous periods and year-to-date results are therefore not comparable.
Historical Stock Returns for Valiant Organics
| 1 Day | 5 Days | 1 Month | 6 Months | 1 Year | 5 Years |
|---|---|---|---|---|---|
| +1.72% | -4.34% | +36.05% | +88.68% | +21.48% | -70.73% |

What specific pricing trends or volume growth in the hydrogenation segment are expected to drive EBITDA margins toward FY23 levels of 14.58%?
How will the dilution of Valiant Laboratories Limited's stake to an associate company impact Valiant Organics' consolidated revenue recognition and profit attribution in future quarters?
Given the 45% revenue exposure to dyes and pigments, how sensitive are the company's FY27 projections to potential regulatory tightening on industrial effluents in Gujarat and Maharashtra?
 15
15







 Access Market Heat-map & Insights
  Create, Save & Share your Screener
  Use 200+ Screening Filters





