

Tirupati Sarjan FY26 Results: Net profit falls 8% to ₹474 lakh


- Net profit fell 8% YoY to ₹474.2 lakh in FY26
- Total income declined 1.8% to ₹21,925.7 lakh
- Finance costs dropped 25% to ₹390.8 lakh
- Debt-to-equity ratio improved to 0.43 from 0.53
- No dividend declared; earnings retained for growth


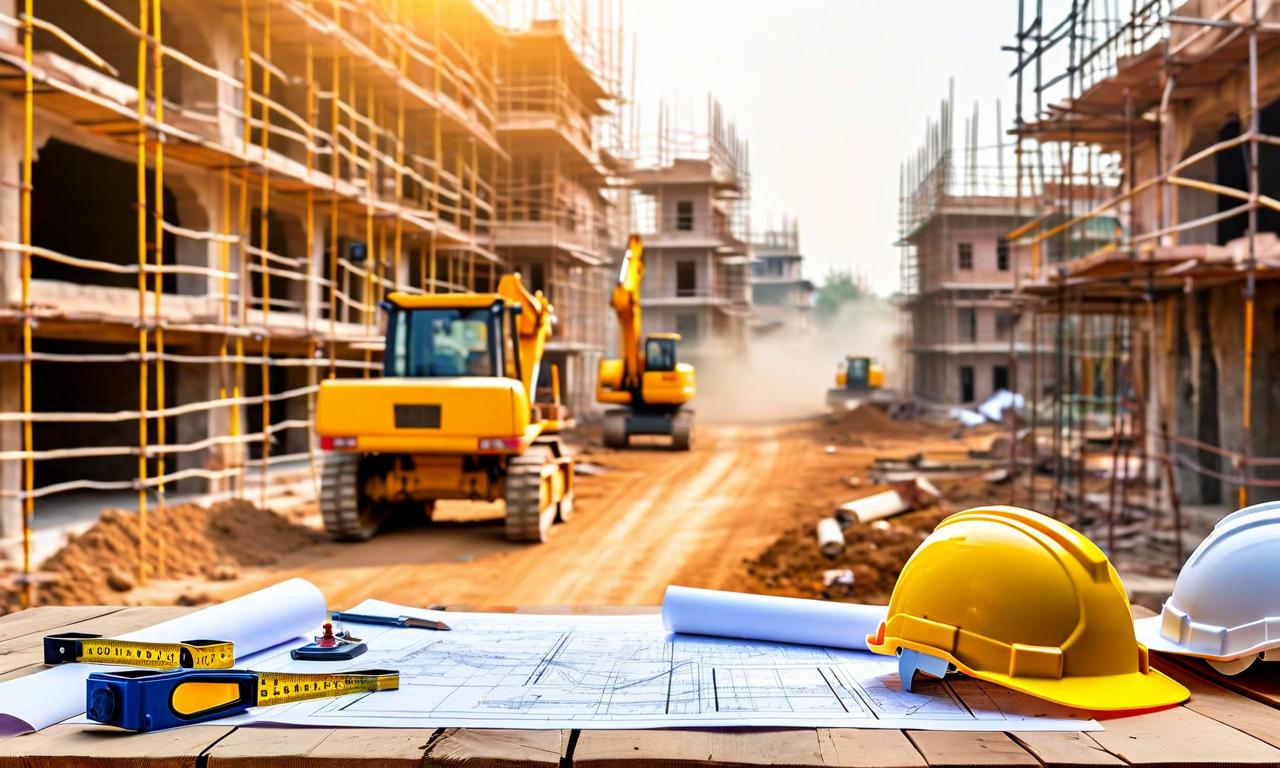
*this image is generated using AI for illustrative purposes only.
Tirupati Sarjan reported a net profit of ₹474.2 lakh for the financial year ended March 31, 2026, a decline of 8% from the previous year’s ₹515.0 lakh. Total income stood at ₹21,925.7 lakh, down from ₹22,325.1 lakh in FY25.
The company’s 31st Annual General Meeting is scheduled for September 30, 2026. Directors recommended retaining earnings for future operations rather than declaring a dividend.
Financial Performance
Revenue from operations decreased slightly to ₹21,626.7 lakh in FY26, compared to ₹22,046.1 lakh in the prior year. Other operating income rose to ₹146.1 lakh from ₹120.8 lakh, while other finance income dipped marginally to ₹152.8 lakh.
| Metric | FY26 (₹ Lakh) | FY25 (₹ Lakh) | Change |
|---|---|---|---|
| Revenue from Operations | 21,626.73 | 22,046.11 | -1.9% |
| Total Income | 21,925.65 | 22,325.09 | -1.8% |
| Profit Before Tax | 659.48 | 744.99 | -11.5% |
| Net Profit After Tax | 474.18 | 514.96 | -8.0% |
Finance costs dropped significantly to ₹390.8 lakh from ₹520.9 lakh, driven by lower interest expenses on borrowings. However, construction expenses increased to ₹11,578.4 lakh from ₹10,867.8 lakh, pressuring margins. Depreciation remained stable at ₹114.5 lakh.
Balance Sheet Signals
Total assets declined to ₹18,617.7 lakh from ₹19,532.3 lakh. Non-current assets rose slightly to ₹9,126.0 lakh, while current assets fell to ₹9,491.7 lakh. Inventories decreased to ₹6,121.2 lakh from ₹6,790.1 lakh, indicating better stock management or project completion.
Gross debt stood at ₹4,040.4 lakh, down from ₹4,731.3 lakh in FY25. Cash and cash equivalents were ₹416.5 lakh. The debt-to-equity ratio improved to 0.43 from 0.53, reflecting a stronger capital structure.
What the Numbers Show
While revenue remained relatively flat, the significant reduction in finance costs helped cushion the impact of rising construction expenses. The decline in trade receivables to ₹2,641.1 lakh from ₹3,186.3 lakh suggests improved collection efficiency, contributing to better working capital dynamics despite lower overall profitability.
Corporate Governance
Mr. Ruchir Rushikeshbhai Patel retires by rotation at the AGM and offers himself for re-appointment. The board also seeks approval to regularize Mr. Bharat Trivedi as an Independent Director for five years. No dividends were declared for FY26.
Historical Stock Returns for Tirupati Sarjan
| 1 Day | 5 Days | 1 Month | 6 Months | 1 Year | 5 Years |
|---|---|---|---|---|---|
| +0.25% | -1.99% | -5.84% | -15.05% | -39.42% | +10.34% |

How might the decision to retain earnings rather than declare dividends impact Tirupati Sarjan's ability to fund upcoming construction projects given the rising cost pressures?
What specific strategies is management implementing to mitigate the impact of the 6.5% increase in construction expenses on future profit margins?
Will the improved debt-to-equity ratio of 0.43 enable Tirupati Sarjan to secure more favorable financing terms for its expansion plans in FY27?
 18
18









 Create Custom Screeners
  Access 200+ Pre-built Filters
  Use 50+ Readymade Screener





