

Tennant Co Q2FY26 Results: Adjusted EBITDA margin falls to 10.9%


- Adjusted EBITDA fell to $35.3 million from $51 million YoY, with margin contracting to 10.9%
- Net sales rose 1.7% YoY to $324 million, while orders grew 6.6% to $339 million
- Robotics revenue surged 37% YoY to $31 million, with full-year guidance raised to $130-$145 million
- Gross margin declined 260 bps YoY to 39.5% due to EMEA competition and North America ERP inefficiencies
- Full-year adjusted EPS guidance lowered to $3.80-$4.45 from $4.70-$5.30

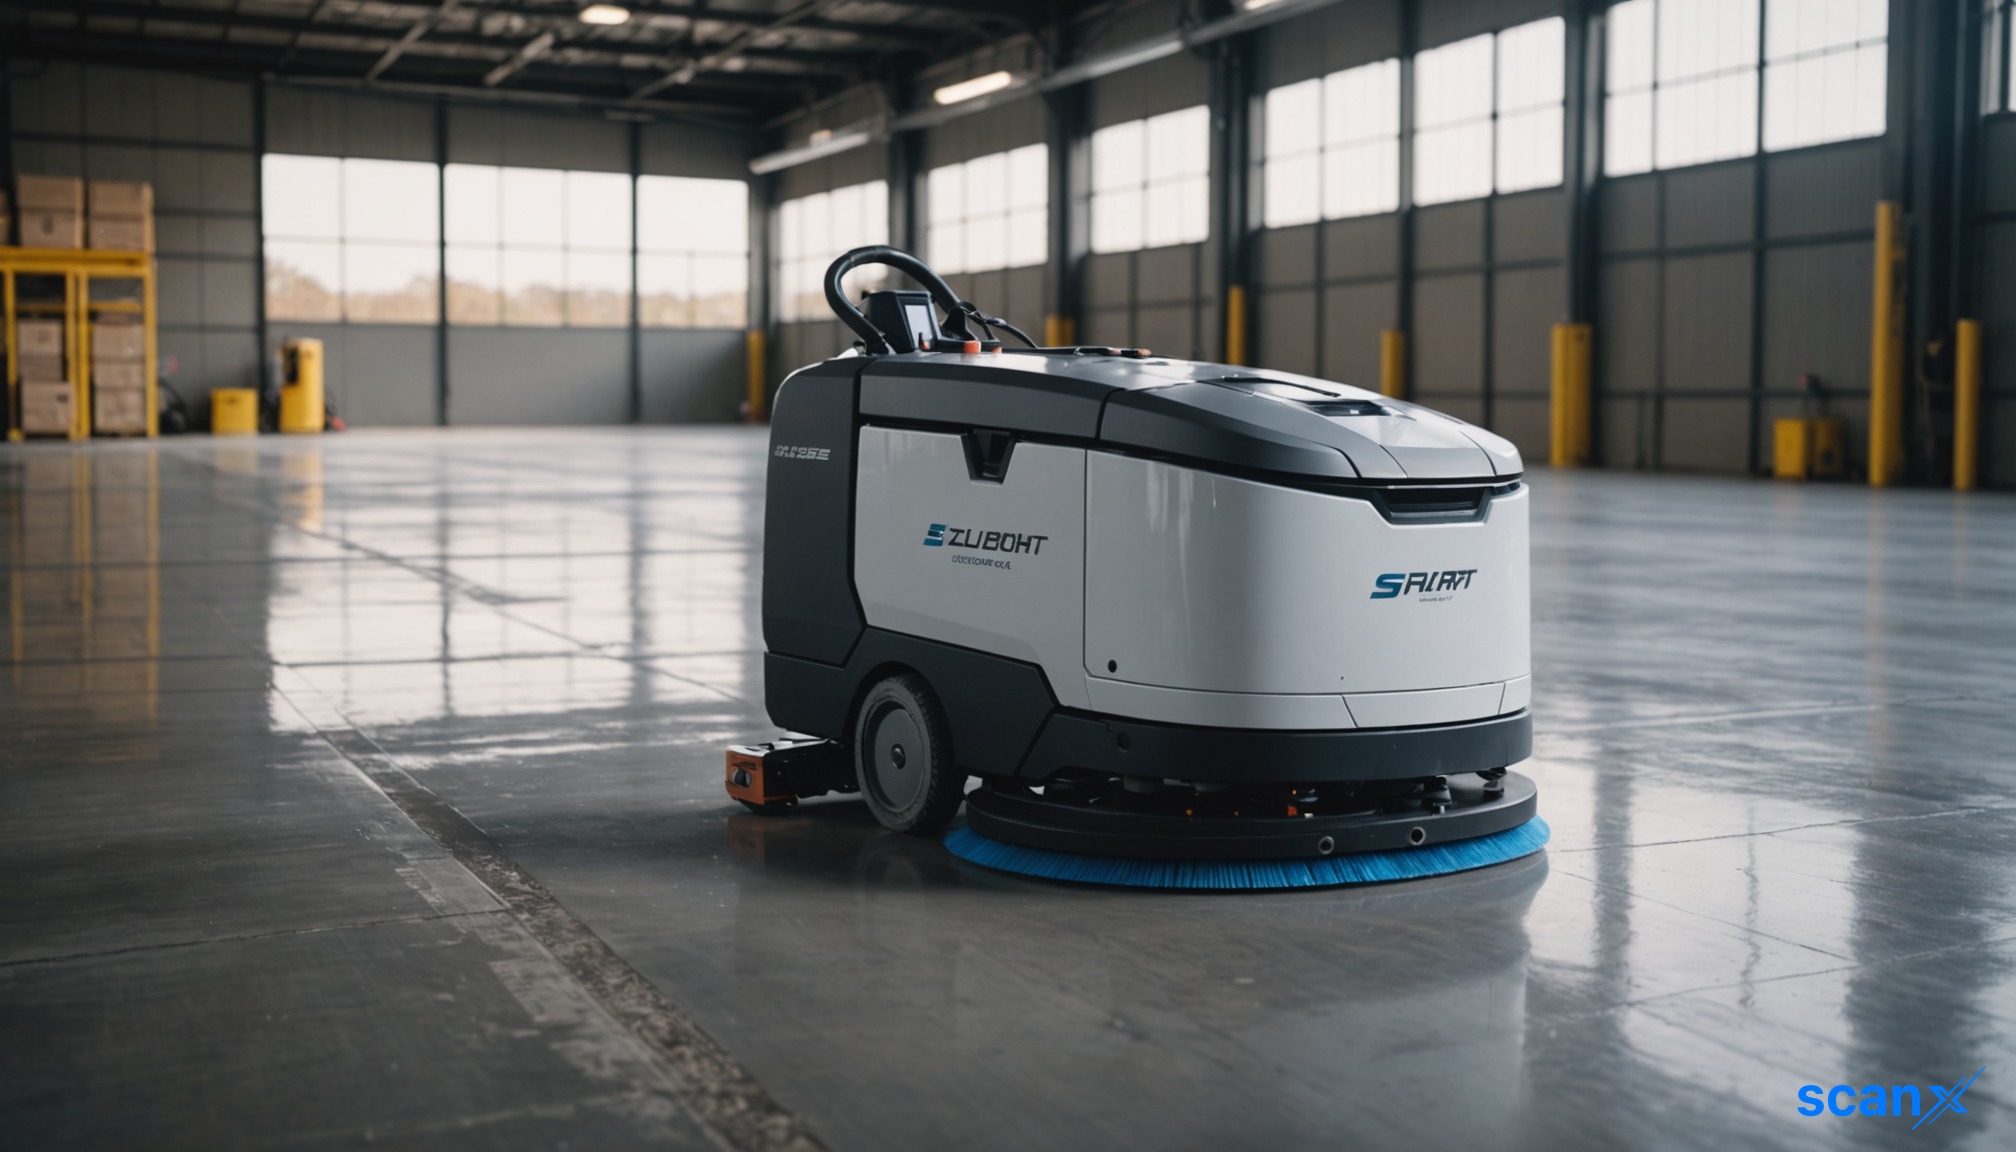

*this image is generated using AI for illustrative purposes only.
Tennant Co reported a decline in profitability for the second quarter of fiscal year 2026, with adjusted EBITDA falling to $35.3 million as operational costs and margin pressures outweighed modest revenue growth.
The company’s net sales rose 1.7% year over year to $324 million, driven by strong order momentum and a 37% increase in robotics revenue. However, adjusted EBITDA contracted significantly from $51 million in the prior-year period, reflecting a margin compression of 510 basis points to 10.9%. The shortfall was attributed primarily to gross margin challenges in EMEA and North America, alongside higher-than-expected operating expenses related to ERP implementation delays.
Regional Performance and Revenue Drivers
Revenue performance varied across regions, with the Americas showing resilience despite supply chain constraints. North America sales remained essentially flat at -0.2%, as robust pricing realization was offset by lower volumes due to parts shortages. In contrast, Latin America delivered strong organic growth of 21%, supported by strategic accounts in Brazil and Mexico. EMEA sales declined 2.8%, pressured by competitive pricing and volume softness, while APAC saw a 10.6% drop amid cautious capital spending.
The robotics division emerged as a key growth engine, with autonomous mobile robot (AMR) sales reaching $31 million in the quarter. This segment is projected to accelerate further, with full-year robotics revenue guidance set between $130 million and $145 million. Service and other sales, including autonomy subscriptions, grew 19.2%, aided by new enterprise agreements.
Margin Pressure and Operational Challenges
Gross margin stood at 39.5%, down 260 basis points year over year but up 140 basis points sequentially. The decline was driven by increased discounting in EMEA, freight and material cost inflation linked to geopolitical conflicts, and manufacturing deleverage. In North America, ERP-related inefficiencies continued to impact production output and fulfillment, leading to elevated backlog levels.
Adjusted SG&A expense increased to $94.3 million, or 29.1% of net sales, compared to 27.3% in the prior year. The rise reflects higher software licensing fees, inflationary costs, and continued investment in robotics capabilities. R&D expense also climbed to $12.5 million, or 3.9% of sales, as the company accelerates its product innovation roadmap.
What the Numbers Show
A divergence between order strength and revenue conversion highlights execution bottlenecks. Orders grew 6.6% year over year to $339 million, and backlog increased by $18 million during the quarter. However, net sales grew only 1.7%, indicating that parts shortages and production constraints prevented the company from converting demand into shipments efficiently. This gap suggests that future revenue acceleration depends heavily on resolving supply chain issues rather than demand generation.
Updated Guidance
Management revised its full-year outlook, raising net sales expectations while lowering profitability targets. The new guidance reflects stronger order momentum and robotics contribution but accounts for slower realization of ERP efficiencies and persistent cost headwinds.
| Metric | Q2FY26 Guidance (Updated) | Prior Guidance |
|---|---|---|
| Net Sales | $1.27 billion to $1.31 billion | $1.24 billion to $1.28 billion |
| Adjusted EBITDA | $155 million to $170 million | $175 million to $190 million |
| Adjusted Diluted EPS | $3.80 to $4.45 | $4.70 to $5.30 |
The company expects gross margins to remain flat in Q3 before improving to approximately 41% in Q4 as ERP optimizations take hold and parts availability stabilizes.

How will the delayed ERP implementation impact Tennant's ability to reduce backlog and improve gross margins in Q4 as projected?
Can the robotics division's growth trajectory sustainably offset the margin compression in traditional equipment segments through FY2026?
What specific supply chain mitigation strategies is management deploying to resolve parts shortages that are currently constraining revenue conversion?








 Access 50+ Readymade Screeners
  Use 200+ Custom Filters
  Get Full Market Insights





